
| NERC solar power cumulative capacity by interconnection by the end of 2012 | |
|---|---|
| Interconnection | Cumulative Capacity (MW) |
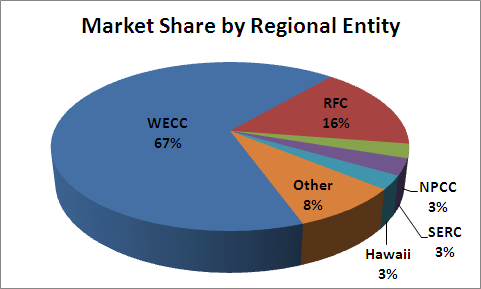
| WECC | 4,862 |
| RFC | 1,167 |
| SERC | 229 |
| NPCC | 198 |
| Hawaii | 206 |
| Other | 619 |
| Total | 7,266 |
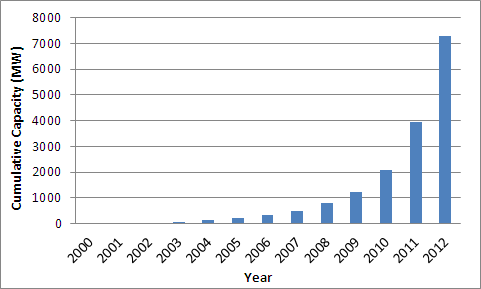
This site provides an overview of the current photovoltaic fleet operating within North American Electric Reliability Corporation’s (NERC’s) regional reliability entities. In 2012 the US solar industry grew by 76% totaling in roughly 3,133 MW of newly installed solar power. This year, the solar power has been installed across 26 states, with California (1,032.7 MW), Arizona (710.3 MW), and New Jersey (414.9 MW) being the states with the highest contribution.
With an average annual growth of 250% during the 2007-2012 period the U.S. solar industry finished 2012 with 7,266 MW of solar power capacity. Overall, the installed solar capacity in U.S. grew by 1500% since 2007.
The eight regional entities under NERC together with Hydro Quebec, Alaska Systems Coordinating Council (ASCC), and Hawaii came to 7,457 MW of installed solar capacity by the end of 2012. The Western Electricity Coordinating Council (WECC), Texas Reliability Entity (TRE) and Midwest Reliability Organization (MRO) have a combined solar capacity of over 5,000 MW or roughly 67% of all NERC solar power.
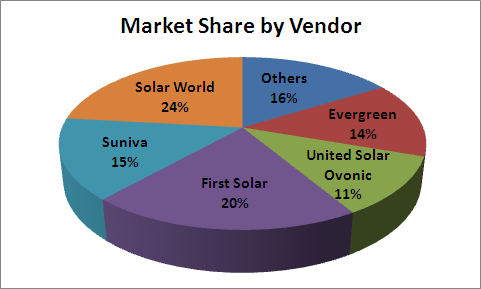
According to a DOE released report, there are more than ten different PV manufacturers supplied the market in 2010. The vendors with the largest share of the considered market, by the end of 2012, were Solar World (23%), First Solar (20%), and Suniva (15%).
| Cumulative installed capacity by state by the end of 2012 ([1][2][3]) | ||
|---|---|---|
| State | Cumulative Capacity (MW) | 2012 Installed Capacity (MW) |
| California | 2,902 | 1,033 |
| Arizona | 1,097 | 710 |
| New Jersey | 971 | 415 |
| Nevada | 403 | 198 |
| Colorado | 270 | 40 |
| North Carolina | 229 | 132 |
| Massachusetts | 198 | 129 |
| Pennsylvania | 196 | 60 |
| Hawaii | 191 | 109 |
| New Mexico | 190 | 25 |
| Rest of U.S. | 619 | 462 |
| Total | 7,266 | 3,313 |
References
- ↑ EERE of U.S. DOE, “2010 Solar Technologies Market Report,” November 2011. [Online]. Available: http://www.nrel.gov/docs/fy12osti/51847.pdf.
- ↑ IREC, “U.S. Solar Market Trend 2012,” July 2013. [Online]. Available: http://www.irecusa.org/wp-content/uploads/2013/07/Solar-Report-Final-July-2013-1.pdf.
- ↑ SEIA, “U.S. Solar Market Insight Report,” Dec. 10 2013. [Online]. Available: http://www.seia.org/research-resources/us-solar-market-insight.