
There’s probably a hundred things to get “right” when performing simulations of VG integration. From transmission to reserve requirements to high-quality, spatially diverse VG profiles, each element of an integration study can radically impact estimates of curtailment and other important performance metrics.
One key parameter for a good integration study is the minimum generation level (sometimes called turn-down ratio) of all the existing and planned “conventional” generators. (As an aside, I wonder when the word “conventional” applied to hydro and thermal will become like “intermittent” applied to wind and solar.) Anyway, minimum generation levels essentially establish a ceiling on the amount of VG that can be provided in any interval.
Given the importance of minimum generation levels to VG deployment, integration researchers, including us at NREL, have spent a lot of time gathering data sets on thermal and hydro generator characteristics. We recently generated a short summary of our collective knowledge on this subject in an article in the journal Energy Policy.
While there is no single master data set available, it is quite possible to get a pretty good idea of minimum generation levels for much of the thermal fleet in the U.S. With enough time and patience, data sets from the U.S. EIA, FERC, and EPA can be mined and used to reconstruct historical capabilities.[1] The EPA’s Continuous Emissions Monitoring System data set is particularly powerful, as it provides actual output levels from many coal- and gas-fired power plants.
These data sets represent a great start—but they leave out a lot of the generation fleet, including hydro, nuclear, and geothermal plants. These data sets also don’t provide sufficient data on the operation of CHP plants, reliability must-run units, emissions-constrained or block-loaded plants, or impact of production tax credits.
Digging deeper, we can pull historical operation data for hydro units from sources such as the U.S. Army Corps of Engineers, and we compiled and processed some of these data sets in NREL’s Eastern Renewable Generation Integration Study data set. Some planning organizations have pulled together interconnection-wide data sets that provide additional information; examples include the WECC TEPPC and California LTPP databases. Beyond that, we are often stuck with examining units on a plant-by-plant basis.
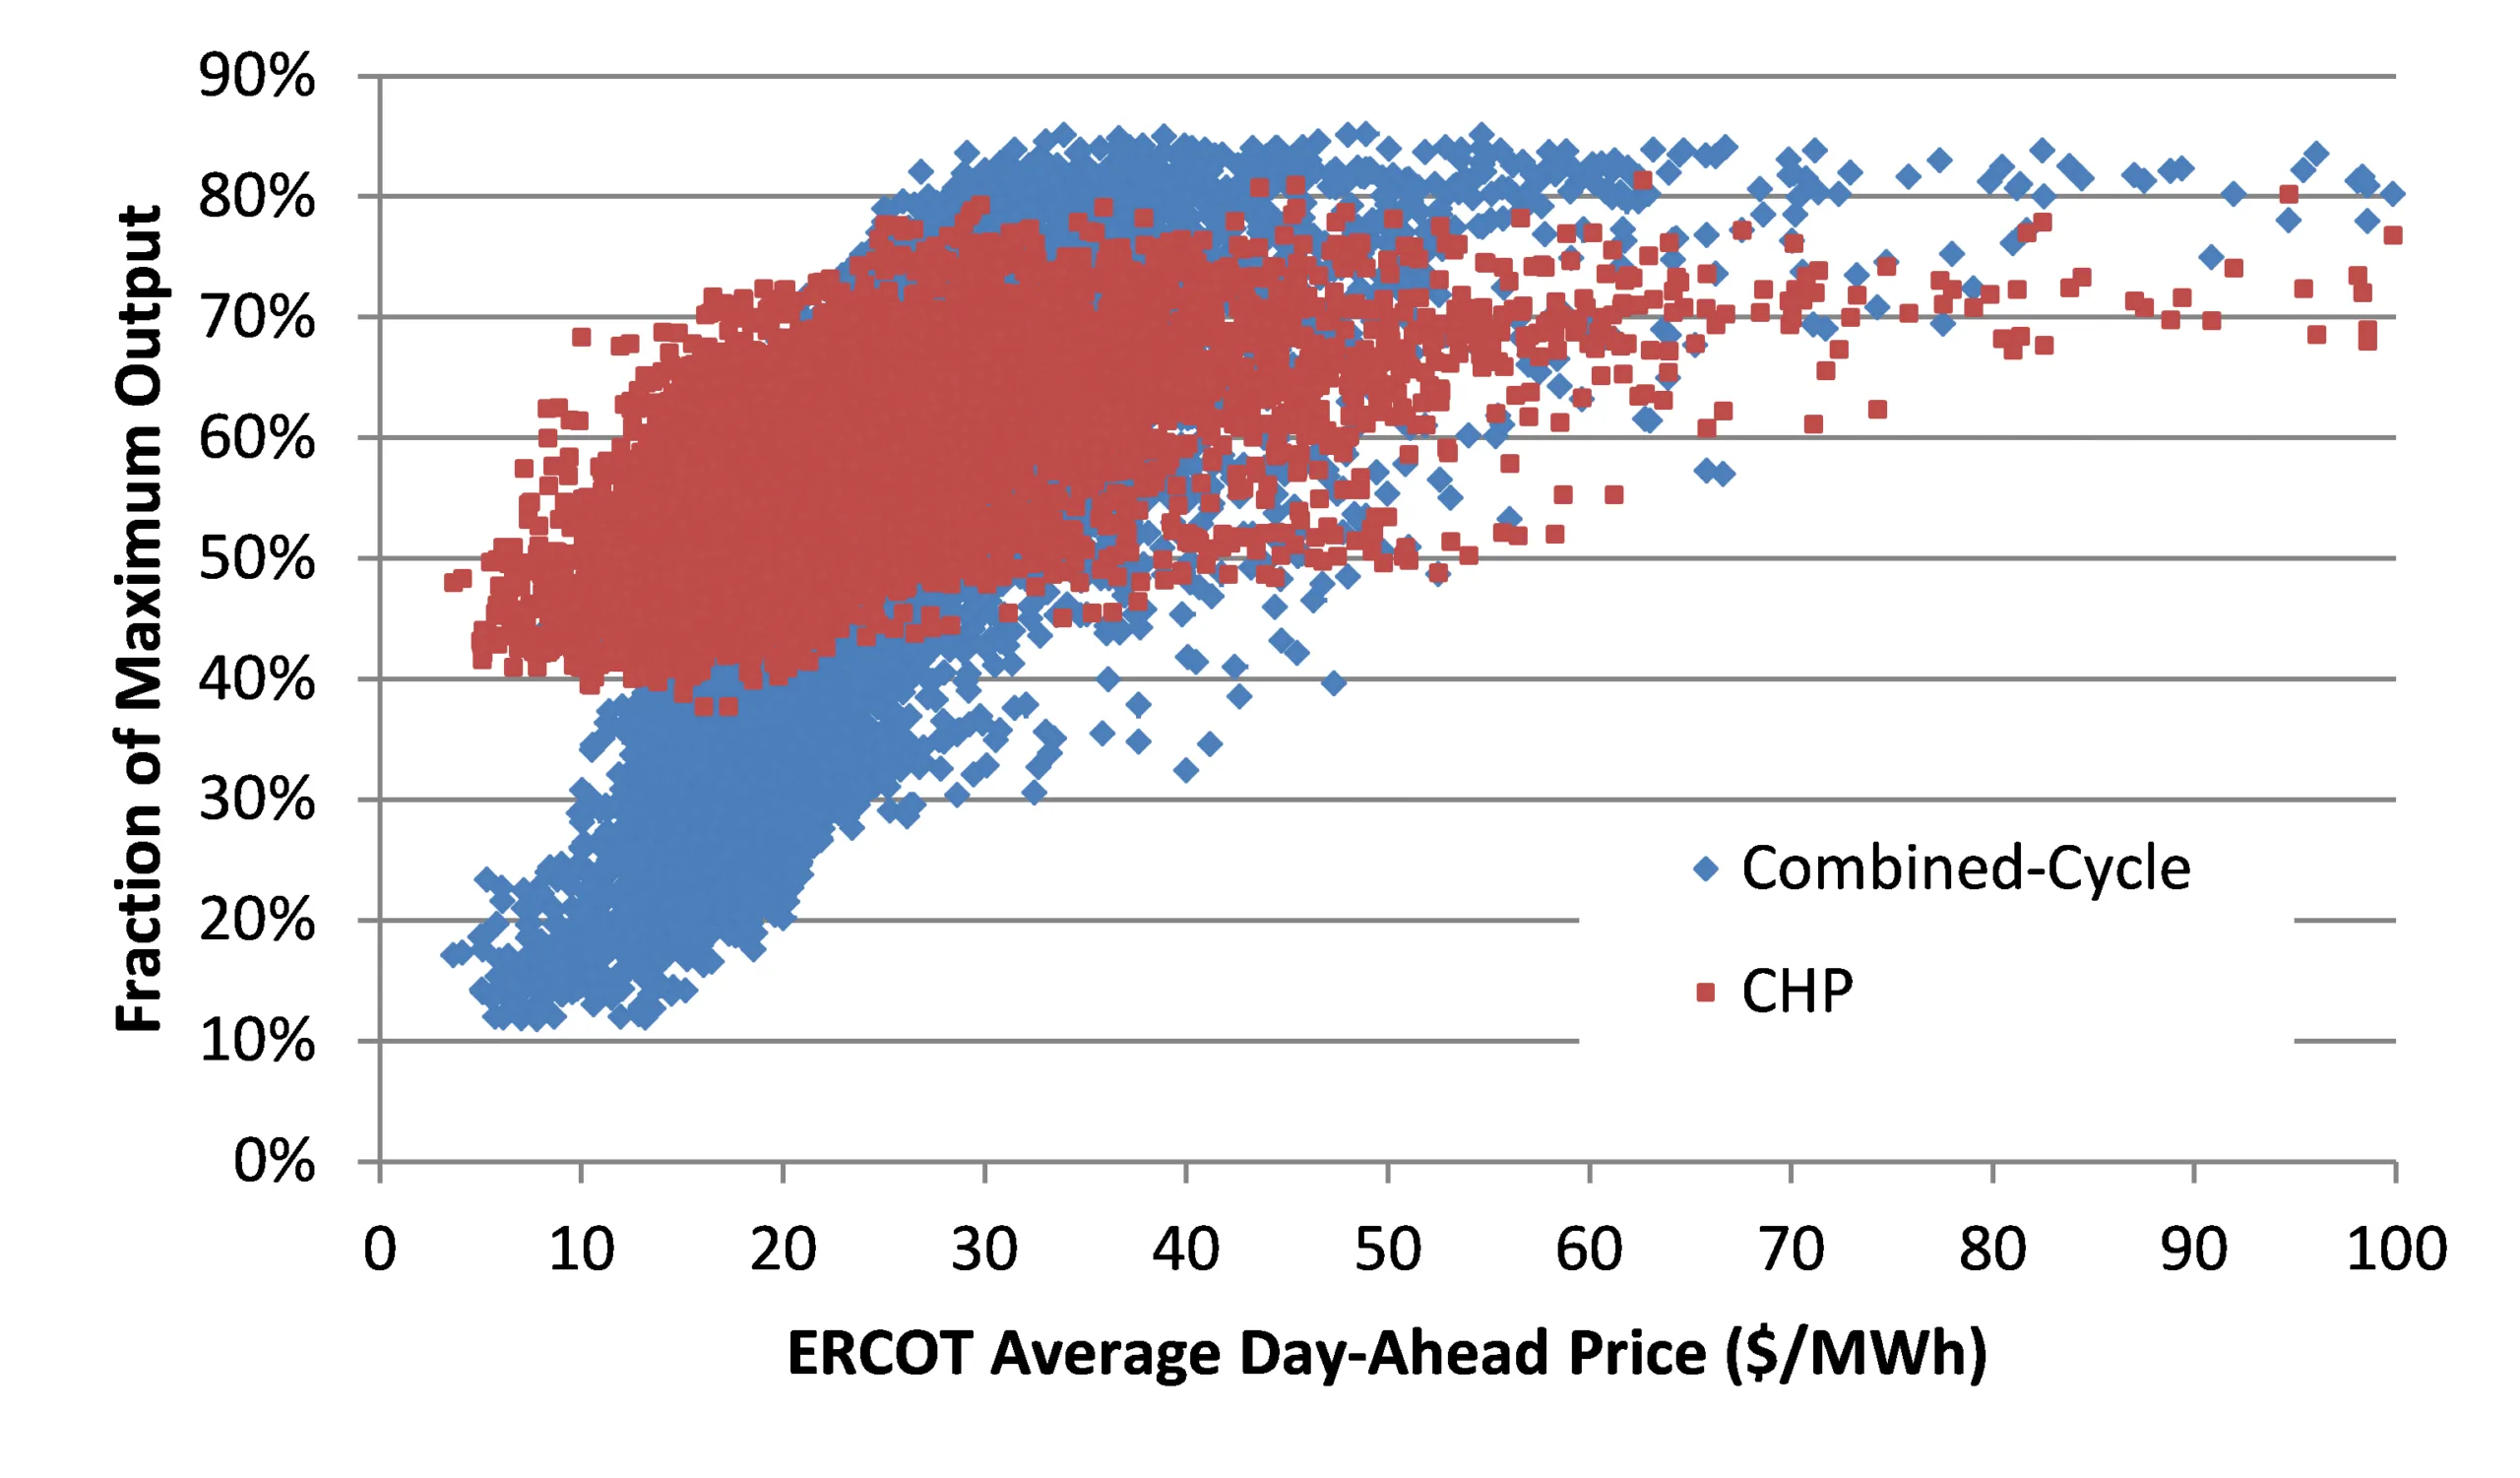
One of the more interesting findings of our survey is how CHP plants (at least historically) don’t really respond to electricity prices and could contribute to the minimum generation problem.
For example, we pulled hourly output data for non-CHP combined-cycle plants in ERCOT from 2015 and compared their output to CHP plants during the same time period. The figure below compares plant output and system price, showing CHP plants running at significant output even when prices are very low and most of the CCs are off. We found similar trends in California—and since both Texas and California are national leaders in both renewable deployment and CHP deployment, this adds significant headaches for engineers trying to model either of these power systems.
So all this means that studying wind and solar also involves a lot of time studying coal and gas plants including understand how they may be economically incentivized to become more flexible. While other technologies such as storage may be more exciting, it always comes down to economics. For example, reducing the system-wide minimum generation by 100 MW will reduce curtailment by a lot more than would adding 100 MW of storage. This is an overly simplistic example, of course, as 100 MW of storage provides a bunch of other benefits—but it points out that we have a long way to go before we are done studying the flexibility supply curve and the role of conventional generators in providing new sources of grid flexibility.
Paul Denholm, Principal Analyst
NREL
[1] I am going to break the rule of defining acronyms in this posting, but they are all easy to find on the internet.