
ISO New England (ISO-NE) has witnessed rapid adoption of behind-the-meter photovoltaics (BTM PV) in recent years, with roughly 160,000 systems totaling almost 3 gigawatts (GW) of nameplate capacity now installed across the region, and approximately 7 GW total anticipated by the end of the next decade. For a system with a 2018 summer peak load of about 26 GW, this growth is already significantly altering the region’s load characteristics. Consequently, and similar to other regions that have experienced similar BTM PV growth, operational load forecasting is becoming increasingly challenging. To address these emerging challenges, ISO-NE is finishing a project to enhance its forecasting tools and processes to better account for the growing influence of BTM PV.
Despite ongoing advances in weather and solar forecasting, forecasting tomorrow’s clouds often remains a highly uncertain exercise. As a result, a growing amount of uncertainty can be expected in operational load forecasts as BTM PV penetrations increase. Moreover, in cold regions such as New England, snow events can pose significant challenges, since forecasts must also account for the extent of snow cover and melting.
Load forecasts are typically based on statistical models (e.g., artificial neural networks) that can capture the nonlinear relationships between load and an array of calendar and weather features. The effects of BTM PV change these relationships by increasing net load’s weather-sensitivity and time-varying volatility. As such, legacy modeling approaches that do not explicitly factor for BTM PV will generally exhibit deteriorating forecast performance. To help mitigate this tendency, ISO-NE has now built data processes and related tools to enable the explicit accounting of BTM PV in its load forecasts.
Since BTM PV system interconnection occurs at distribution voltages, comprehensive installation data were historically not available to ISO-NE. However, as part of long-term forecasting efforts begun in 2013 when BTM PV growth surged, ISO-NE established a process to collect town-level installed capacity data from the region’s distribution utilities. This allowed for the monitoring of geospatial growth trends of all systems, from rooftop-scale to megawatt-scale, that today feeds operational awareness.
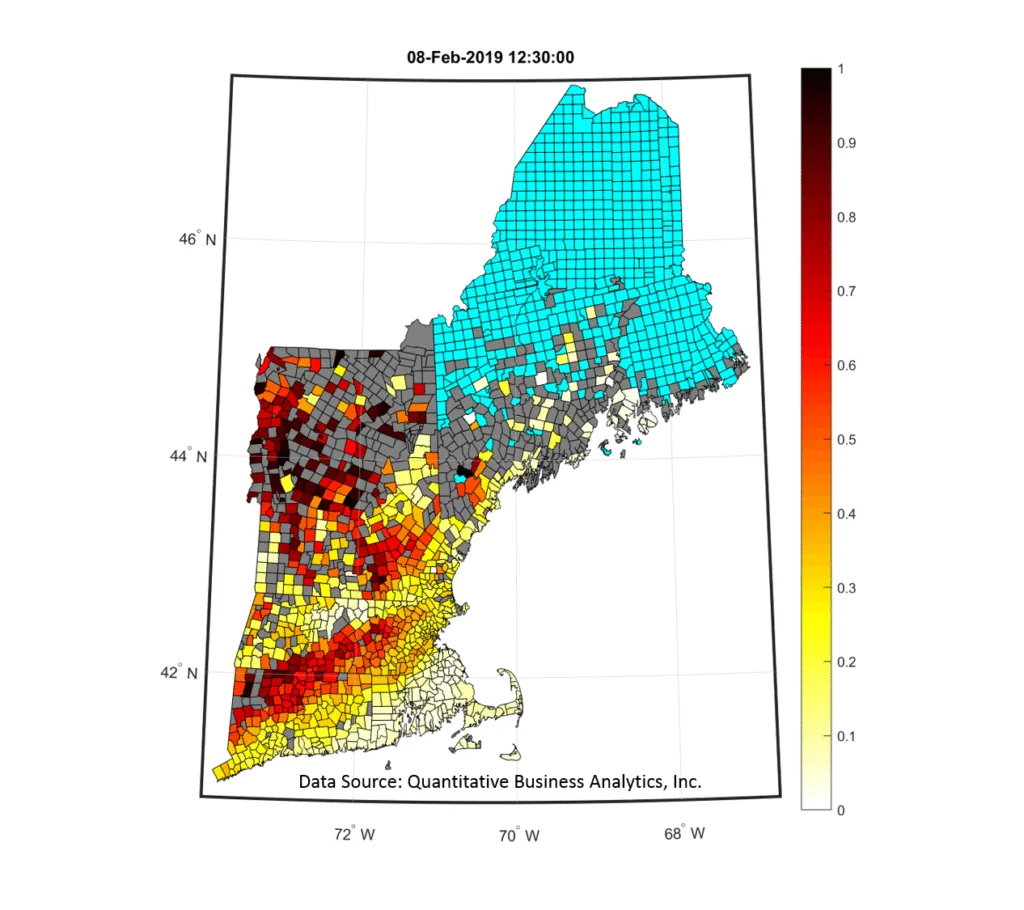
Since ISO-NE cannot directly observe the output of the entire BTM PV fleet, an important project milestone was gaining sufficient visibility (or “ground truth”) foundational to forecasting. To achieve this, ISO-NE acquired vendor data from approximately 10,000 reference systems, binned temporally in 5-minute increments and geographically at the town level. A snapshot of the BTM PV performance data is shown in the heat map below, which illustrates performance of the reference systems at 1230 hours on February 8, 2019. The color scale shows performance on a per unit nameplate capacity basis, with dark red reflecting production near nameplate capacity. Gray towns are those where reference data are not available, and blue towns where data are not requested. The coherent spatial patterns reflect the effects of prevalent cloud features across the region, with contrasting bands of cloudy (pale yellow and white) and sunny (dark red) conditions, illustrating the importance of relatively granular performance data to capture such weather features.
 Using a data science approach, the installed capacity and performance data are combined to “upscale” the output of the BTM PV fleet in a manner that captures the important effects of both localized weather and geographical heterogeneity of BTM PV installations.
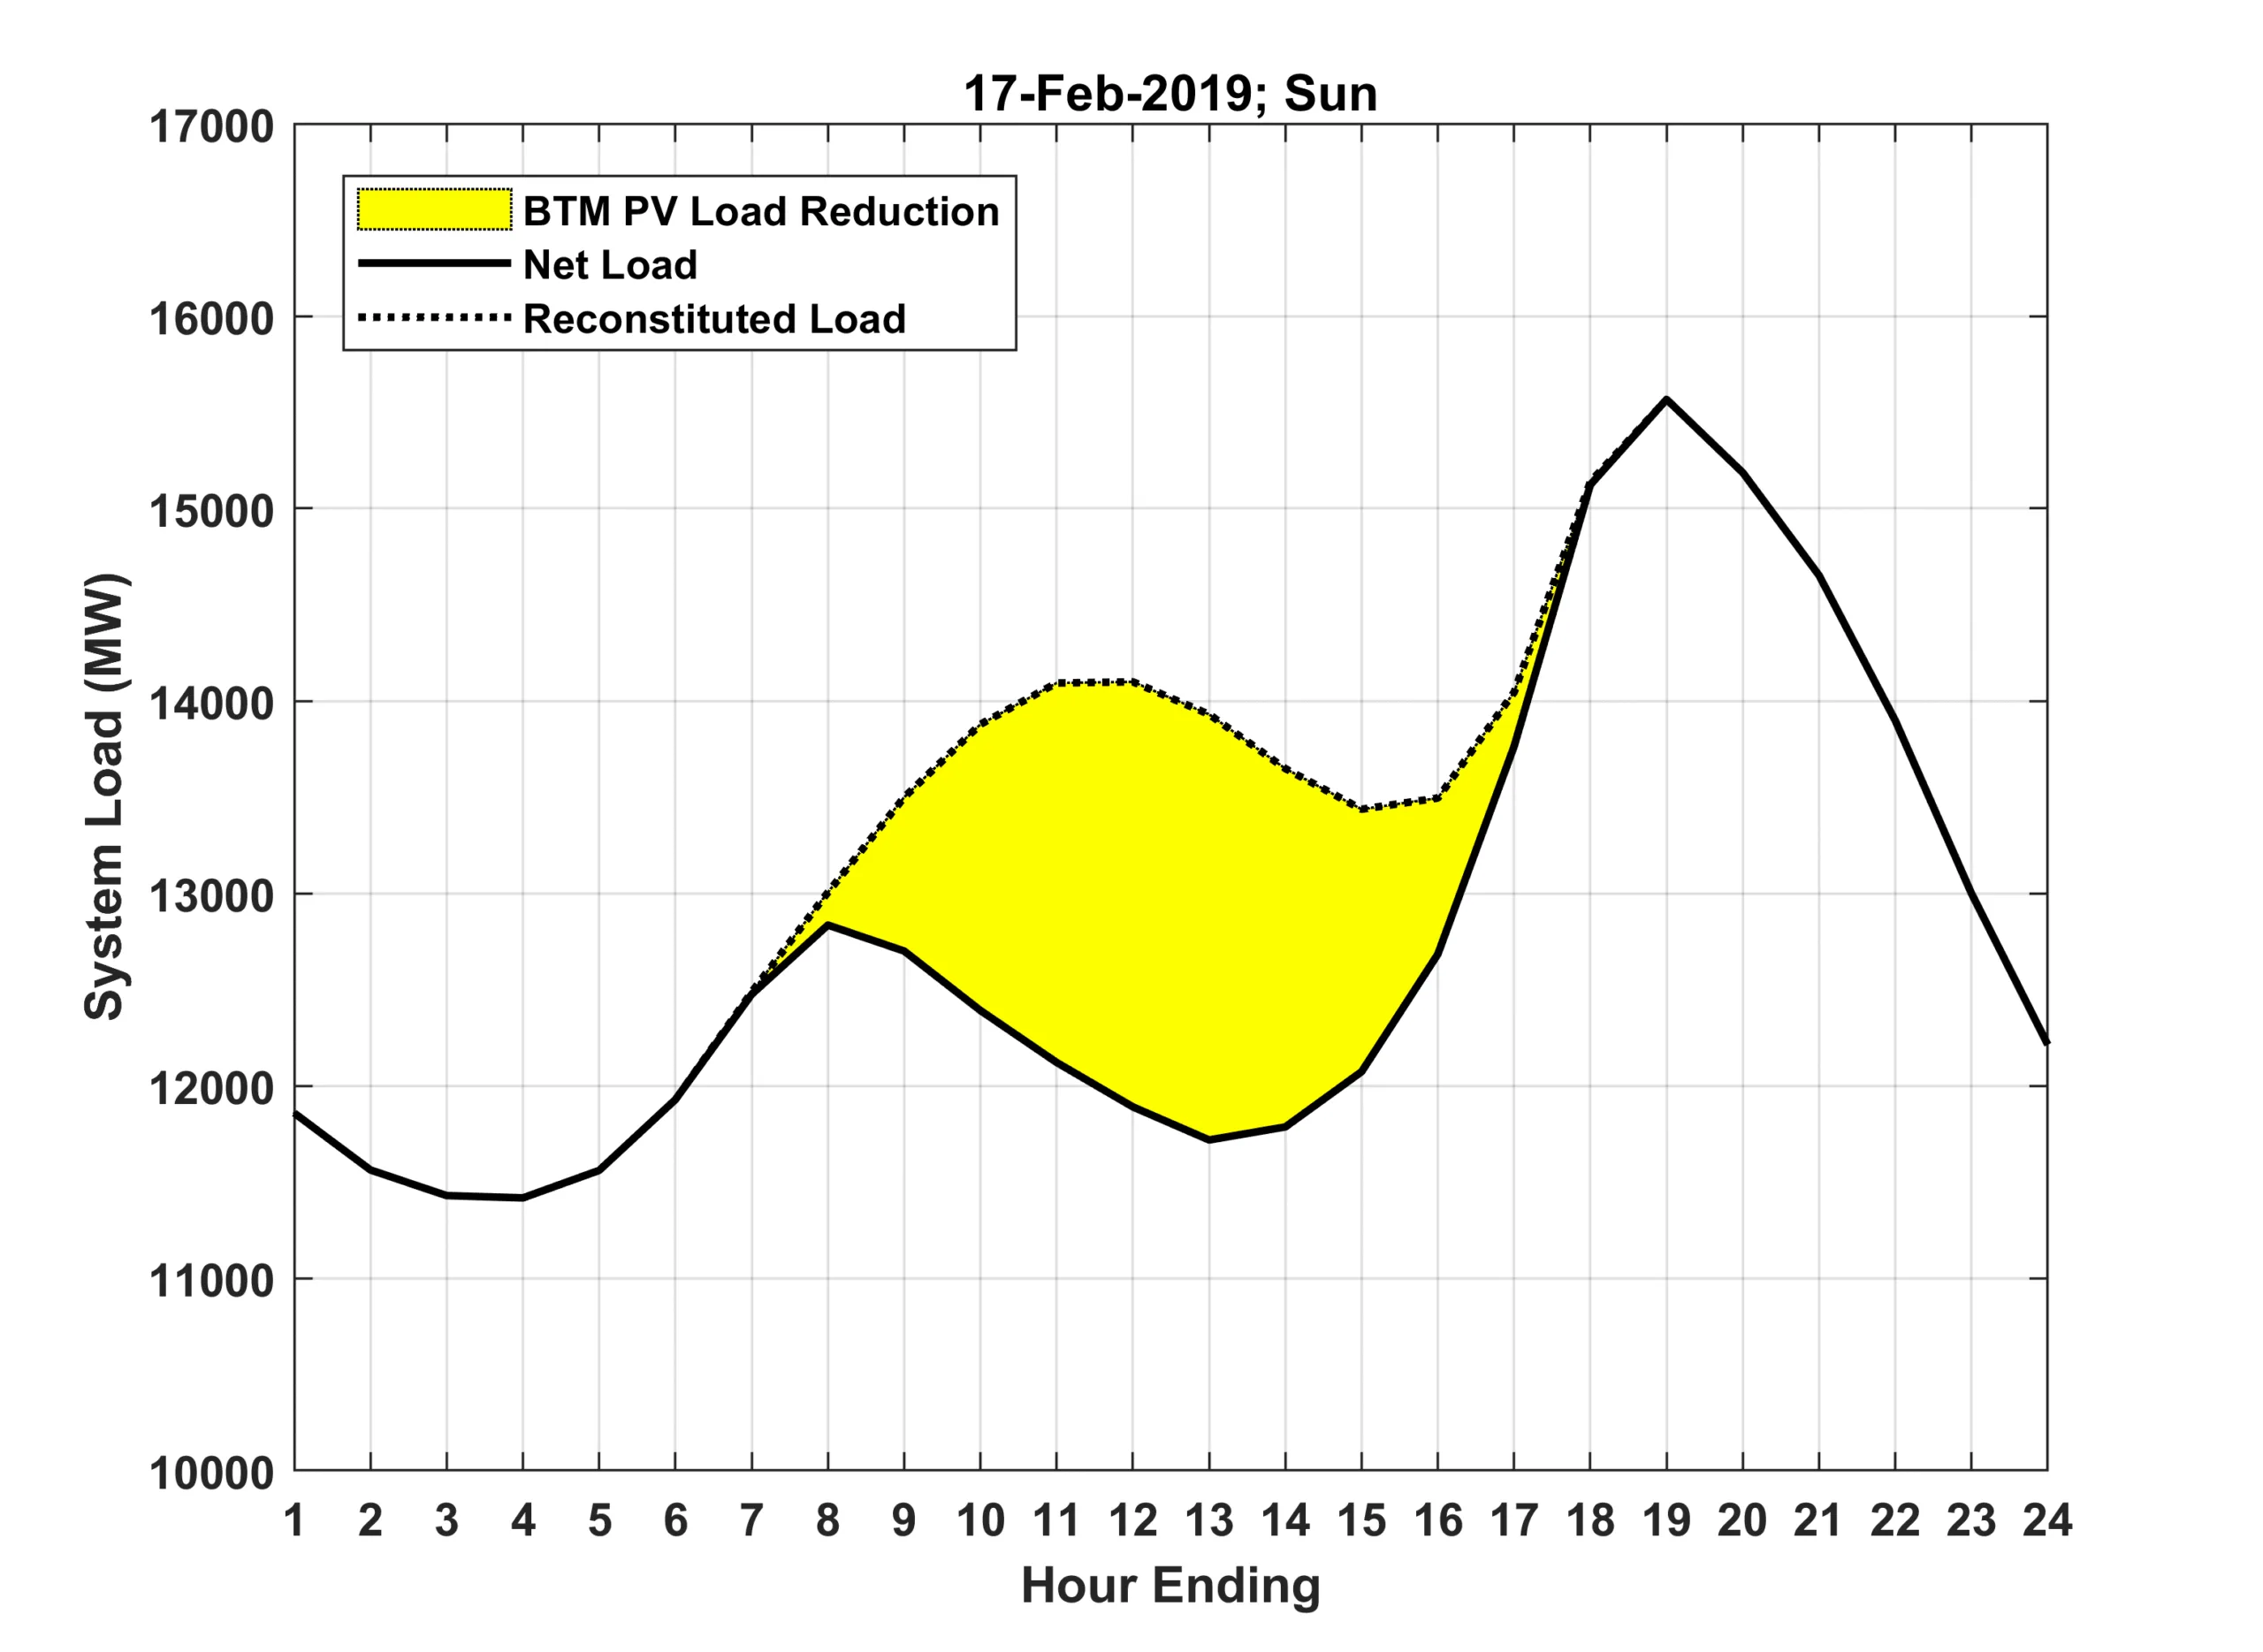
With these data in place, forecast models are trained using loads with BTM PV output added back (or “reconstituted”), thus eliminating its load-masking effects, and restoring model performance to “no PV” conditions. These models are subsequently used to produce reconstituted load forecasts, from which vendor-provided BTM PV forecasts are subtracted to yield net load forecasts. To illustrate these concepts, the plot below shows reconstituted and net load profiles for February 17, 2019, a mostly sunny winter day with more than 13 gigawatt-hours of BTM PV load reductions. Adapting this example to a forecast scenario, the dashed line is what the new reconstitution models will forecast, the yellow area is the BTM PV load reduction to be forecast, and the solid black line is the net load forecast.
The newly developed data intelligence and tools will better position ISO-NE to forecast the region’s rapidly evolving load profiles. In addition to improved net load forecasting performance, reconstituted load profiles also provide critical information for forecasters, since they reveal the amount of load that can suddenly become “unmasked” during periods of heavy rain or snow cover. As the industry accumulates greater experience load forecasting with larger BTM PV penetrations and other emerging technologies at the customer end of the power system, we all stand to benefit from learning from one another to improve overall methodologies and best practices.
Jon Black
Manager, Load Forecasting
ISO New England