
Although I was raised in Georgia and now live in Iowa, I “grew-up” professionally in California as a planning engineer for PG&E, 1985-1990, performing dynamic analysis of the Western Interconnection (WI). The nature of many WI dynamic problems is such that it is essential to model the entire WI when studying them, yet, computational barriers motivate use of reduced models. Although having a “wide-area” view is therefore familiar to me, I would never have guessed during those early years that I might someday construct a single US electric systems model spanning the Atlantic to Pacific seaboards – more on this later.
Today, “wide area planning” of electric systems is of high interest when assessing investment options. There are three motivations for this. The first is that resource quality of wind and solar-PV investments has high spatial variation. For example, Mississippi, Alabama, Georgia, Florida, and South Carolina have almost no land area with 80m capacity factors above 25%; yet, for 80m capacity factors above 40%, there are four states having land area exceeding 50,000km2 (Oklahoma, Wyoming, Iowa, and Montana) and six states having land area exceeding 140,000km2 (North Dakota, Kansas, South Dakota, Nebraska, Texas, and Alaska) [ref: http://apps2.eere.energy.gov/wind/windexchange/wind_maps.asp]. A 2012 report assuming a 1-axis tracking collector having a power density of 48 MW/km2, estimates annual solar PV capacity factors 17-19% for most northern states in the Midwest and Northeast, 21-24% for Great Plains states of Texas northwards to South Dakota including Wyoming, Montana, Idaho and Oregon, and 24-27% for the six most Southwestern states [ref: www.nrel.gov/docs/fy12osti/51946.pdf]. The second motivation for wide-area planning is that, unlike fossil fuels, which may be transported in multiple ways, energy from wind and solar-PV are moved only by electric transmission. Thus, to identify least-cost investment options, one needs to account for tradeoffs between resource quality and transmission distance, making it useful to assess very wide areas. A third motivation is that wide area planning accounts for energy and capacity benefits associated with load diversity across different time zones.
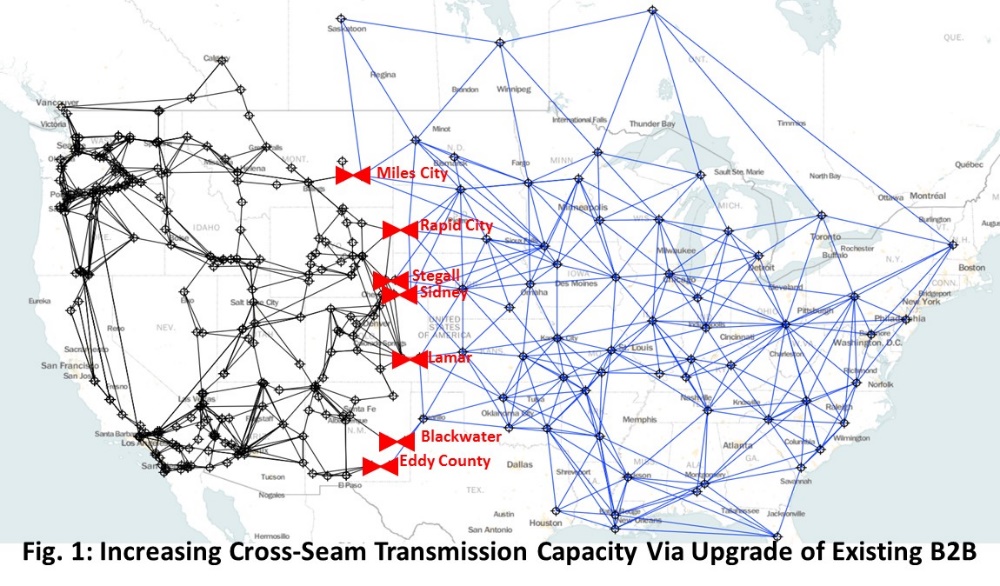
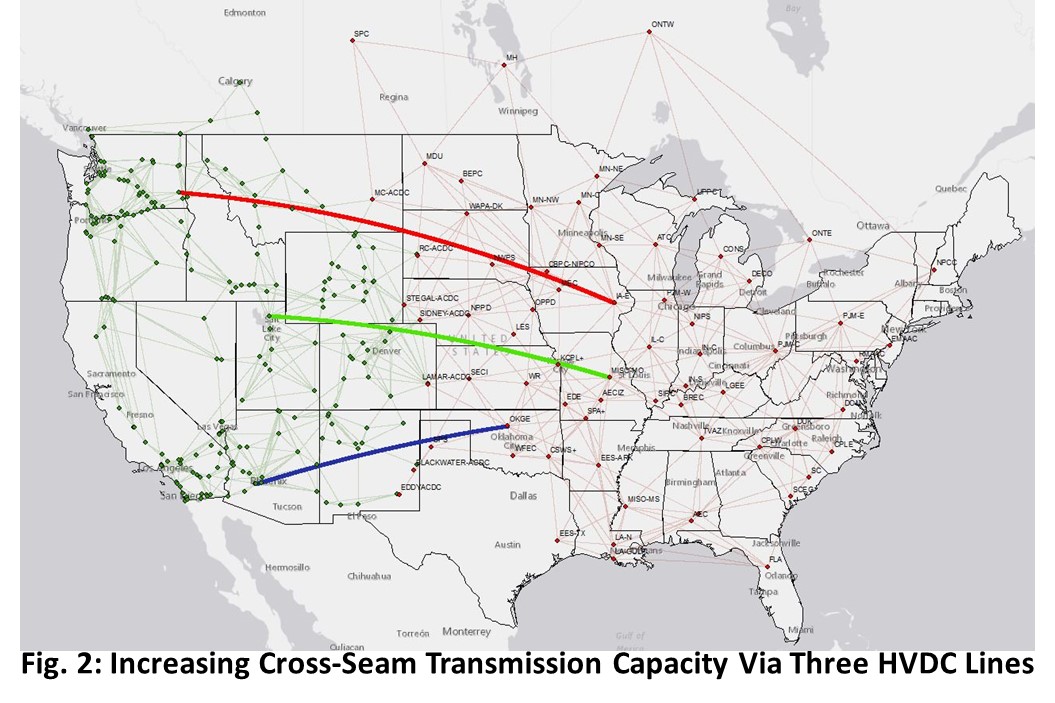
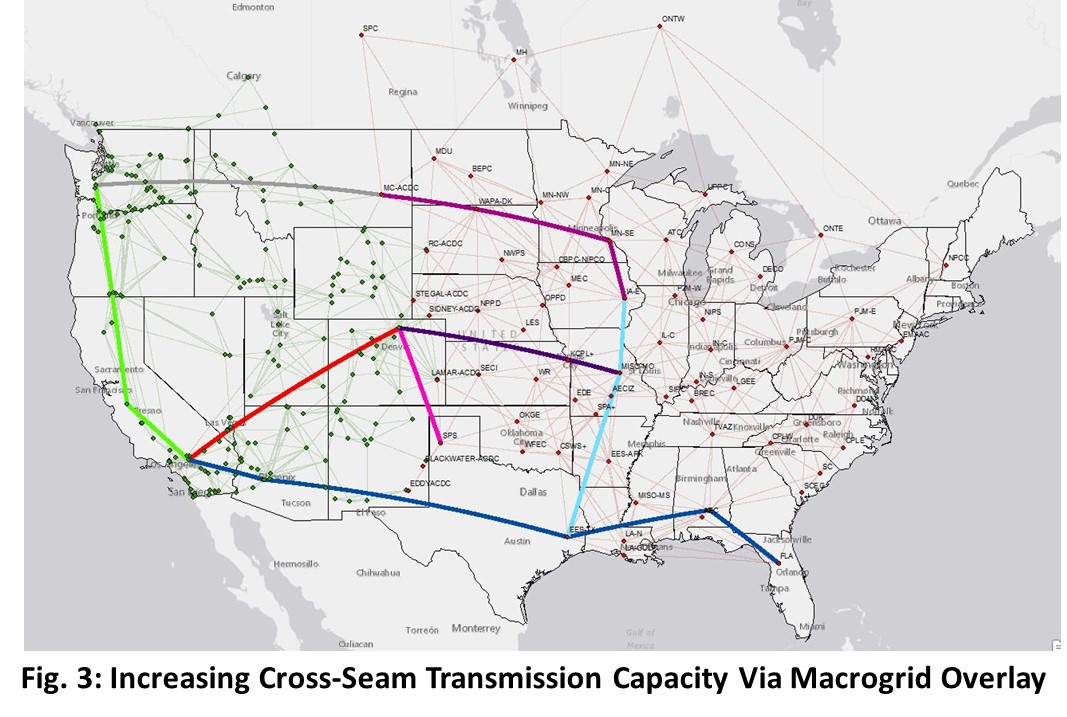
This thinking has led a team managed by NREL under the DOE-funded Interconnection Seams Study (see www.nrel.gov/analysis/seams.html) to identify the value, under a high-renewable future, of increasing the existing U.S. 1,310 MW of back-to-back (B2B) transmission capacity across the north-south “seam” between the Eastern Interconnection (EI) and the WI. Participating organizations include MISO, SPP, WAPA, WECC, PNNL, ANL, ORNL and Iowa State University. We are studying three different designs, the first of which increases cross-seam transmission only at the seven existing US B2B facilities, as shown in Fig. 1. A second design, shown in Fig. 2, increases cross-seam transmission via three HVDC lines terminated interior to the EI and WI, respectively, potentially attractive because it leapfrogs some of what otherwise might be AC transmission bottlenecks between the seam and the coastal load centers. The third design, shown in Fig. 3, is the macrogrid overlay, an HVDC network spanning most of the US. Analysis of these three designs begins with co-optimized expansion planning (CEP) of generation and transmission, and proceeds to production costing and then power flow analyses. The CEP step uses a software application that identifies optimal resource and transmission expansions necessary to minimize net-present worth of investment, operational, and environmental costs over a planning horizon (in this case 2024-2038). Choices among technologies (e.g., solar PV, wind, natural gas combined cycle, combustion turbines for resources; 345, 500, or 765 kV AC, ±500, ±600, or ±800 kV HVDC for transmission), location, amount, and timing are determined by the optimization software. Alternatively, a specific design may be “constrained-in” by the analyst for focused exploration. This computationally intensive tool requires reduction of a 60,000-bus EI model and a 20,000-bus WI model to be tractable; the number of buses in the EI/WI model shown in the figures totals 335. Wide area planning and reduced models – where have I heard that before? The Interconnection Seams Study is fully underway; early indications are that cross-seams transmission can bring significant value for a high-renewable future. Look for further results next fall!
James McCalley
Professor of Electrical & Computer Engineering
Iowa State University
Leave a Reply