
Hawaii continues to be a hotbed of solar activity with high penetrations of distributed, customer-sited installations. As in California and Arizona, Hawaiian utilities are already contending with some of the highest levels of distributed generation in the nation with over 17% of utility customers with installed or approved PV systems. Further renewable momentum and PV plus storage adoption is likely to continue as the state and utilities strive to meet one of the nation’s most aggressive Renewable Portfolio Standard (RPS) goals of 100% renewable energy by 2045.
To meet the operating needs of the future and achieve a 100% RPS by 2045, the Hawaiian Electric Companies are not just wishing for solutions to increase visibility and capabilities but are aggressively pursuing and leveraging federal and state grants and industry partnerships. Consistent with enabling grid modernization strategies, the Companies are jump-starting technology deployment pilots and gaining new operational experience. This will inform development and build operational procedures for managing more dynamic renewables and distributed resources.
Seeing is believing. Transforming the electric power system requires new tools and technologies with the intelligence to manage diverse distributed resources and handle emerging dynamic transactive energy models.
Seeing is informing. Operating the future grid requires proactive analytics and heads-up predictive capabilities.
Seeing is enabling. Planning the grid of the future requires innovation and collaborations with “like-minded industry partners” and engaged customers to increase awareness and adopt sustainable solutions.
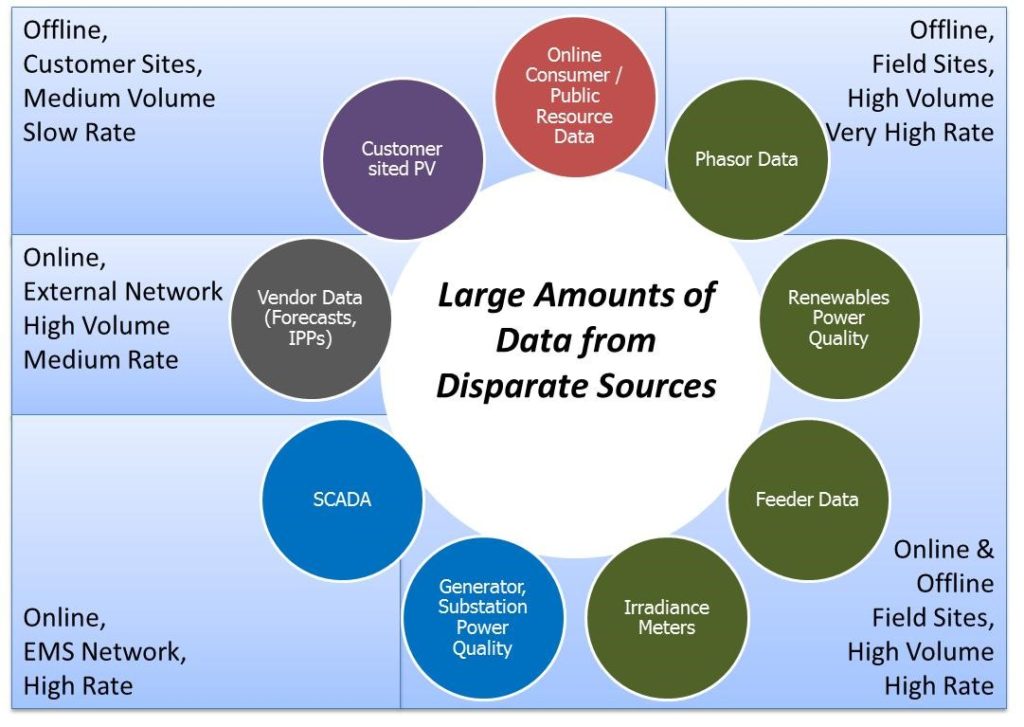
Dealing with distributed system management, speed to see and manage a diverse data pool is paramount to informing real-time decision making. New visualization tools and data-mining capabilities and a fleet of remote monitoring sensors are providing perspective to help shape future grid capabilities and offer better customer options for managing energy use. A few innovative data integration and visualization tools helping Hawaiian utilities to “see and manage” increasing penetrations are highlighted here.
- The Renewable Database and Decision Analysis Framework (REDatabase) provides the backbone to support automation of real-time visualization tools (REWatch), distribution model automation, real-time data access, translation and integration of data for information sharing to stakeholders and customers via online web-tools. Hawaiian Electric Companies partnered with Referentia/In2lytics to develop and operationalize REDatabase. Staff now can retrieve, assess and merge non-SCADA and full resolution SCADA information at data access speeds that are 200 times faster than previously available. They can build customized tools to access high resolution, high volume data from field devices like synchrophasors and AMI meters to interface with other customer information for planning or troubleshooting. Most importantly, utility operators and planners share a common platform to conduct event analysis with quick access to real-time source datasets across diverse platforms (public, web-based, corporate-level secure SCADA networks) while preserving confidentiality and network security requirements.
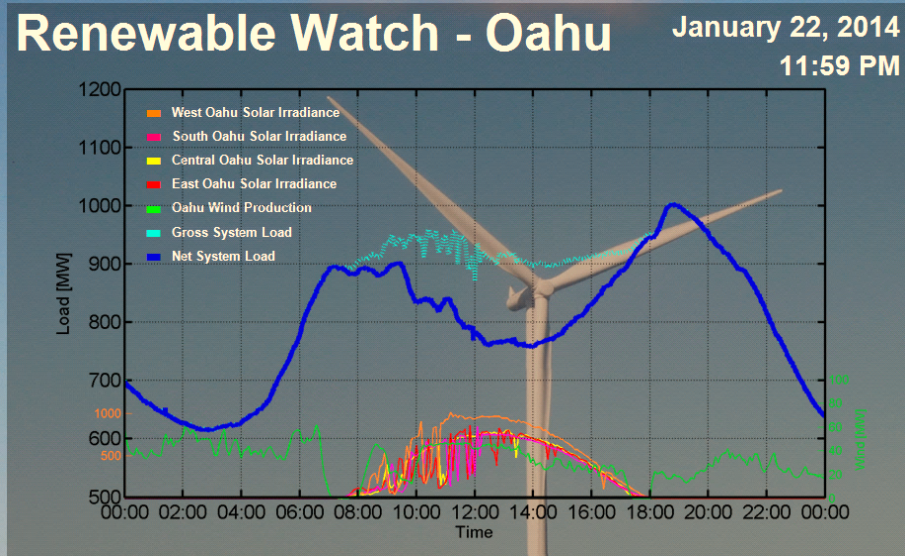
- The Renewable Watch (REWatch) enabled by the REDatabase provides customers access and visibility to the system load and the amount of solar and wind generation contributing to the grid in real-time. Prior to REWatch, there was no insight to account for aggregated distributed PV generation from behind-the-meter rooftop PV systems for planning or operations. As this information is not readily measured, rollout of the REWatch data and visual displays resolved an immediate visibility problem. It is now possible to get real-time visibility to distributed PV production from hundreds of thousands of distributed PV generation sites without additional costs or wait time in deploying metering or new PV monitoring devices.
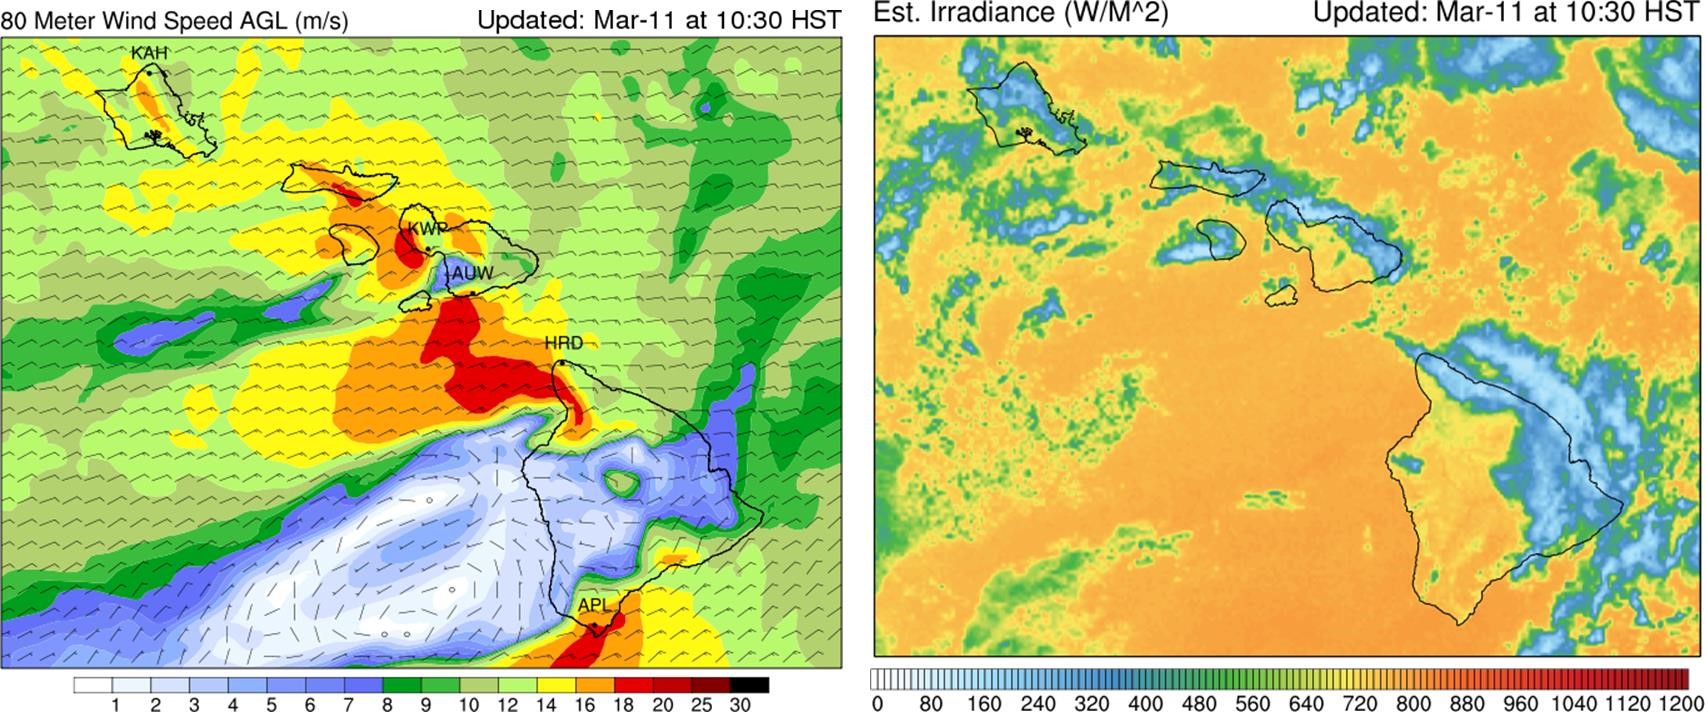
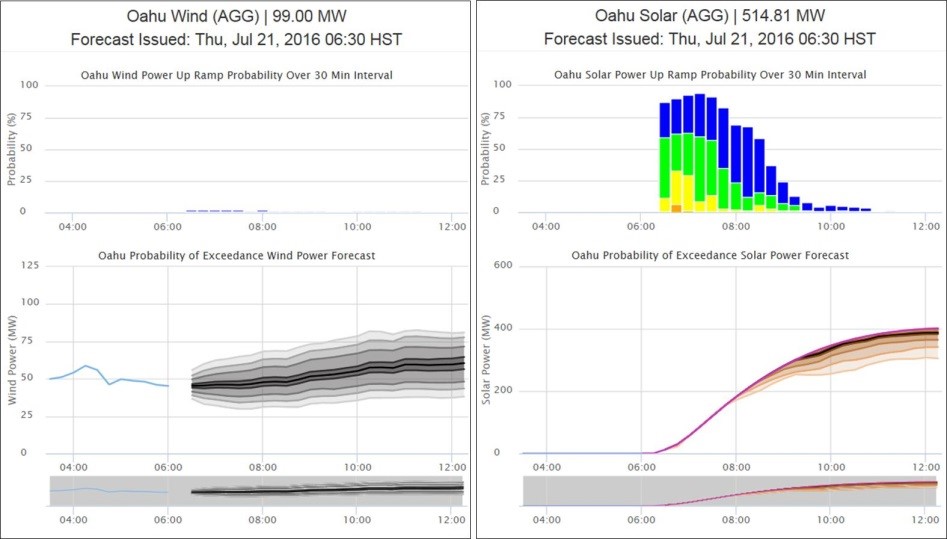
- The Solar and Wind Integrated Forecasting Tool (SWIFT) provides a real-time look ahead (15 minutes up to six hours) of prevailing conditions in wind and solar for the Hawaiian Electric Companies service area, developed in collaboration with AWS Truepower. The SWIFT tool uses state-of-the-art numerical weather and meso-scale models along with a utility operated remote sensor network. The network is comprised of sonic detection and ranging (SoDAR) and light detection and ranging (LiDAR) sensors, irradiance sensors and radiometers to provide resource forecasts and a bird’s eye view of the wind and solar conditions for the islands. The distributed solar forecasting feature is unique to SWIFT, as it provides discrete forecasts for distribution level solar resources. This provides both the localized substation and system control views for informing and balancing localized solar impacts on system-wide operations. Forecasting is not a “silver-bullet”, but by bridging new information with existing tools within familiar utility environments, system operators are engaged and developing a level of confidence in the appropriate use of forecasts for their real-time needs.
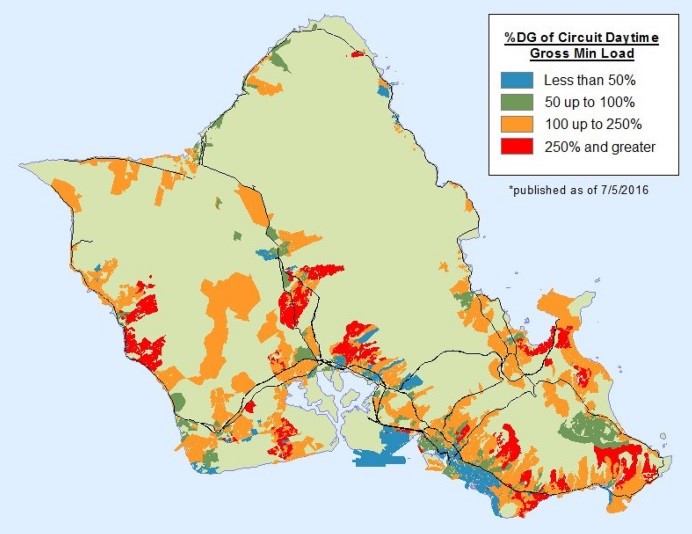
- The Locational Value Map (LVM) provides visibility to high penetration locations to better inform customers and developers of areas that are likely to experience longer interconnection times or may require upgrades for interconnection due to high penetrations of existing installed PV levels. These visual tools translate complex planning data concerning grid impacts into more transparent messages for engaging customers.
These new tools have cost-effectively created visibility and awareness to what was not previously visible and continuously provides resource performance data to inform operations and planning. These visualization tools will help targeted enhancements and enable more reliable integration and adoption of clean energy alternative and customer-sited distributed resources.
As penetration of distributed resources continues to increase in Hawaii to meet the 100% RPS requirement, additional opportunities are emerging for integrating these proactive renewable awareness capabilities are emerging. Integration efforts underway include the US DOE sponsored project. This allows one to seamlessly see and manage edge-of-grid intelligence for dynamic grid operations through demonstration of grid responsive distributed resources located at customer sites. The tools and platform within the SEAMS for SHINES initiative are flexible and scalable by design. This provides a solid data-driven, future grid foundation to support developing plug-n-play and evolving internet-of-things capabilities.
 Efforts to date have provided hands-on, practical opportunities for utility staff and industry forecasters and EMS developers to engage and dialog on needs. By “kicking the tires” on forecasting tools, analytical tools and deploying field equipment, forecasters and utilities have shared understanding of the level of details and forecasting accuracies necessary to support real-time operations.
Lessons learned through collaborative partnerships are resulting in more intuitive visualization tools, data sharing and EMS logic to help other utilities gain more familiarity integrating renewables. No one technology will be a sole solution or “silver-bullet”. However, by seamlessly integrating more edge-of-grid device and merging information into existing tools and familiar environments, such as the EMS, utilities are building operational confidence and trust to proactively inform and cost-effectively manage impacts of variable renewables.
The grid of the future requires new models, new intelligence, and new standards backed by a new workforce with the confidence and tools being enabled, implemented and exemplified under these collaborative initiatives.
Dora Nakafuji
Director, Renewable Energy Planning
Hawaiian Electric Companies
Leave a Reply