
Distribution System Data
Electric vehicles (EVs), demand response, and distributed energy resources have all increased bi-directional interactions and the complexity of the power grid between the substation and the customer. Correctly managing these resources and understanding their impact requires detailed models of the electrical distribution system.

Tarek Elgindy
However, data on U.S. distribution systems are poor. Until recently, public data of distribution systems were limited to single-feeder models which, while valuable for testing the impact of new technologies on power quality, do not capture the diversity and complexity of real-world networks. Real distribution system data managed by utilities may be missing data (e.g., secondary lines connecting distribution transformers to homes), may be maintained in formats that are difficult to simulate (e.g., GIS), and are often difficult to obtain by researchers without extensive non-disclosure agreements.
Synthetic power grid models that are “realistic but not real” provide an excellent solution to this conundrum. The idea is to build models of the electricity system that contain similar design features, equipment, and structures as those seen in real utility grids but have topologies that are different from the layouts that exist on the ground. These open-access models would avoid the missing or unvalidated data problems that plague real utility data. They would also provide the complexity and diversity of real utility data while alleviating concerns about sharing proprietary information. This allows researchers to test innovative algorithms for problems like demand response, EV charging strategies, or power quality management with PV deployments on the distribution system, and be confident that their results will be applicable to real utility grids. Researchers wouldn’t have to worry about how to obtain utility data or go through time-consuming processes to clean the utility data they receive. They also would be able to directly cite and compare their results to other studies, which is difficult or impossible when working with utility data.
Generating Synthetic Datasets
To combat poor data coverage of U.S. power grids, the Advanced Research Projects Agency-Energy (ARPA-E) launched its GRID-DATA program to build synthetic datasets of the U.S. electricity system.
As part of the GRID-DATA program, the National Renewable Energy Lab, Comillas University in Spain, and the Massachusetts Institute of Technology (MIT) partnered to develop the SMART-DS datasets (Synthetic Models for Advanced, Realistic Testing: Distribution Systems and Scenarios). These datasets connect synthetic distribution lines to real building footprints, covering millions of customers over thousands of distribution feeders which are embedded in the four areas of Santa Fe, New Mexico; Austin, Texas; Greensboro, North Carolina; and the San Francisco bay area, California (Figure 1).
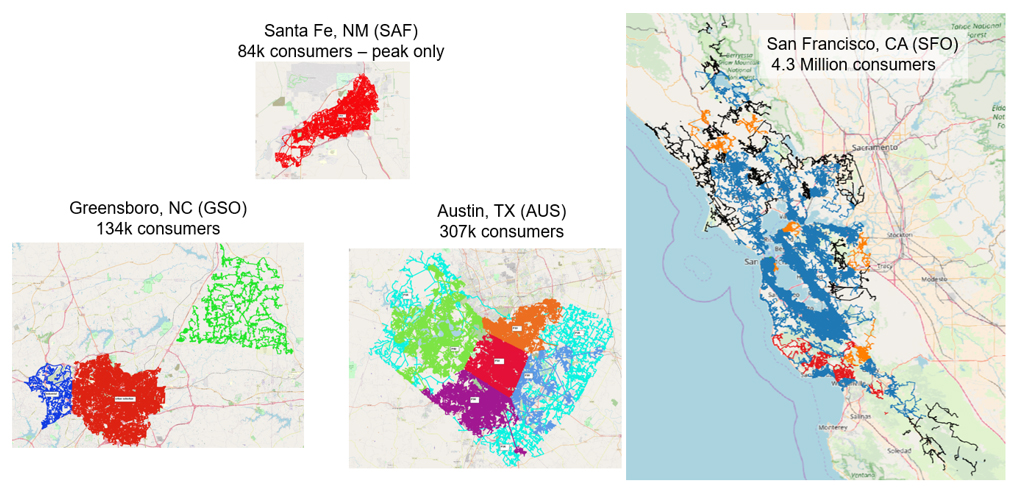 Figure 1. Geographical Areas Covered by SMART-DS Datasets (Source: Shapefiles available on Open Energy Data Initiative)
The creation of these synthetic datasets involved many separate processes. The first was to obtain parcel information describing the location, size, and category of the buildings in the target area. This was used to estimate peak load information for each building. The second was to develop a catalog of electrical equipment (transformers, lines, capacitors, etc.) that would be used to build the synthetic network. The third step was to pass the load information, catalog, and data from OpenStreetMaps to the Reference Network Model for U.S. Systems (RNM-US). This tool sized and placed electrical equipment from the catalog to support the peak planning loads. Once the synthetic electrical networks were created, postprocessing was used to apply controllers to devices and ensure the smooth running of the networks.
Time series loads were attached from synthetic residential and commercial load datasets (ResStock and ComStock). Scenarios were then created where solar panels and batteries were placed in various locations across the dataset with irradiance time series data attached. Each scenario included different penetrations of solar and battery adoptions, including a base scenario with no solar or battery installations. Summaries were produced for each feeder, detailing the total load, line length, voltage, and many other metrics. Finally, the voltages at each node were computed from running power flow simulations in OpenDSS.
Validation
To guarantee that these datasets look like real electrical distribution networks, three approaches were taken. The first was to solicit detailed feedback from a technical review committee that was used to update and calibrate the datasets. The second was to run power flow simulations on the data to ensure that voltages and equipment overloads were within ANSI ranges. And the third was to produce statistical comparisons of the dataset to real utility data. Metrics for key features of feeders such as line length, total load, underground-to-overhead line ratio, etc. were extracted from thousands of real feeders that were obtained from utilities across the United States under a non-disclosure agreement. The statistical distributions of these metrics were compared to those of the synthetic feeders, as illustrated in Figure 3 below, and used to adjust the data generation process. This demonstrated that the diversity of the SMART-DS feeders was comparable to the range of feeder designs seen in reality.
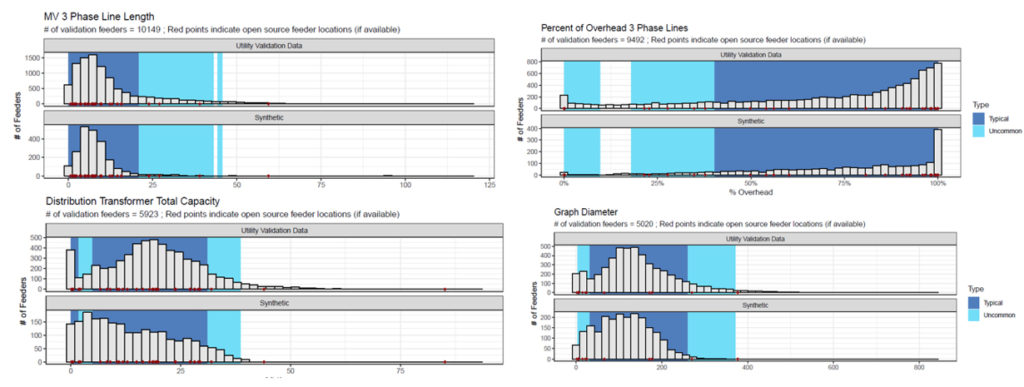
Figure 2. Statistical Comparison of Metrics for Synthetic and Real Feeder Data (Source: Validation of synthetic US electric power distribution system data sets in IEEE Transactions on Smart Grid)
SMART-DS Datasets
The SMART-DS datasets that have been produced are a treasure trove of data, with applications to a wide range of energy systems integration research. They contain synthetic time series loads for individual buildings at 15-minute resolution with breakdowns of different end uses. This means that researchers can develop demand-response algorithms specific to heating, cooling, lighting, or other systems. Most buildings are connected to distribution transformers with low-voltage lines (120 V or 480 V), while some large customers connect directly to the medium-voltage system (at 4 kV, 12.47 kV, or 25 kV). This allows researchers to capture the impact of solar adoption and load variation patterns on secondary lines, which may be a limiting factor for solar integration. In addition to a diversity of voltages, diversity in wiring configuration (delta vs. wye) within the datasets is provided. Feeders containing the medium- and low-voltage lines also include protection equipment such as fuses, reclosers, and switches. Although all feeders are operated in a radial configuration, open switches are provided between some feeders.
When simulating responses to outages or disasters, integrated protection equipment and feeder reconfigurability can show how a real distribution system could respond to outages and what type of post-disaster responses could be deployed. This provides valuable data for resilience modelers to improve responses and operation under threats to the power system. Feeders also contain voltage control equipment such as capacitors and voltage regulators, depending on how the feeder is loaded and whether it’s in an urban or rural location. Analyzing advanced control strategies for this equipment could improve voltage management and allow increased adoption of EVs or solar deployment without significant upgrade costs.
Several substation designs are utilized in the datasets, and each substation serves a number of feeders. A sub-transmission system then connects substations together. This allows modelers to understand use cases such as how unbalanced loading may affect substation operations or transmission-distribution interactions. Scenarios with various solar and battery deployments have been generated which place distributed energy resources across the grid. This allows researchers to understand the impact of different levels of distributed energy resources as well as volt-var and volt-watt control strategies on power quality. Scenarios have also been created with various synthetic lists of EV charging locations, demand-responsive loads, grid monitoring equipment, and line outages. This allows researchers to easily select pre-made use cases for their study.
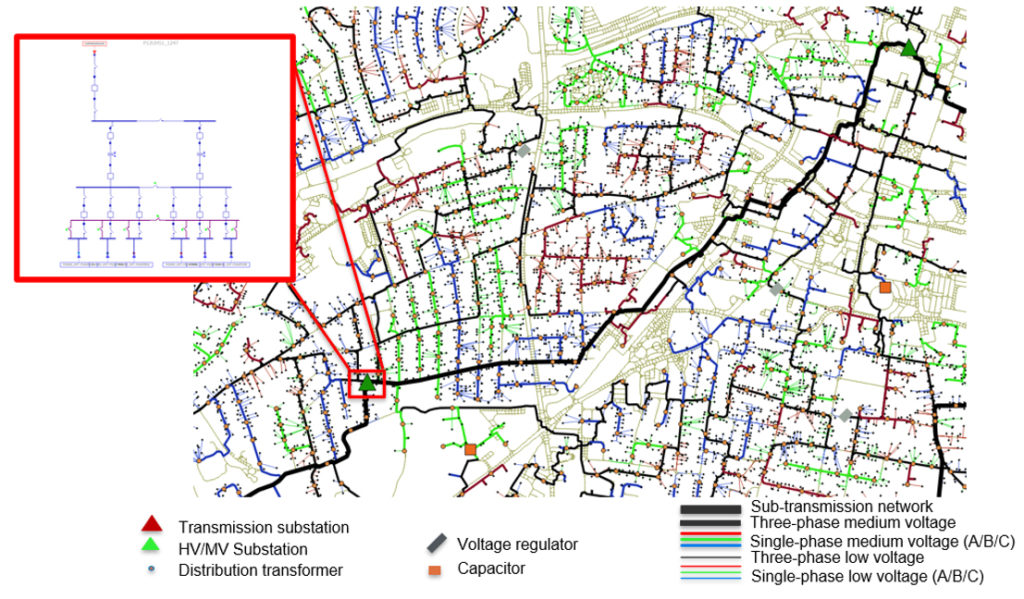
Figure 3. Section of SMART-DS Data from Shapefile (Source: Shapefiles available on Open Energy Data Initiative)
The data are provided in CYME, OpenDSS, and Geojson formats, as well as in Shapefiles as shown in Figure 3. CYME is a commercial power flow simulation tool that is used by many utilities for distribution system planning and management. OpenDSS is an open-source power flow simulation tool. Power flow simulations can be run for single feeders, substations, or regions containing several substations. Geojson formats are used for encoding a variety of geographic data structures, while Shapefile is a format for storing geographic location and associated attribute information. A detailed description of the datasets can be found in the documentation here.
Accessing the Data
The SMART-DS datasets are publicly available online through the Open Energy Data Initiative (OEDI). An AWS S3 bucket for the data is located here. We are excited to share these datasets with the grid integration research community and believe that they will help answer many research questions about electrical distribution systems.
We hope that this next generation of distribution datasets facilitates the research and analysis required to transform the electrical distribution system in the United States for the 21st century.
Tarek Elgindy
Research Engineer, NREL
Great Information. Thanks for Sharing.