
A case study in South Australia
Under Frequency Load Shedding (UFLS) is the last resort “safety net” that protects consumers from a black system event when severe disturbances occur. It involves the automatic disconnection of large quantities of load in millisecond timeframes to rapidly rebalance the power system and arrest frequency decline following a severe contingency event, such as a loss of multiple large generating units, or a major interconnector.

In the South Australia region, underlying customer demand typically ranges between 1,000 to 2,000 MW. As of June 2021, ~1,600 MW of distributed PV (DPV) was installed in South Australia. DPV has now supplied up to 77% of customer demand in some periods, and South Australia has reached a minimum operational demand of only 300 MW. With DPV growth continuing at a rate of approximately 20 MW per month, it is anticipated that operational demand in South Australia could reach zero under some conditions as early as October-December 2021.
In South Australia, UFLS systems are now critically impacted by growth in DPV and declining minimum demand. A suite of actions is underway to address these emerging challenges.

How does DPV affect UFLS?
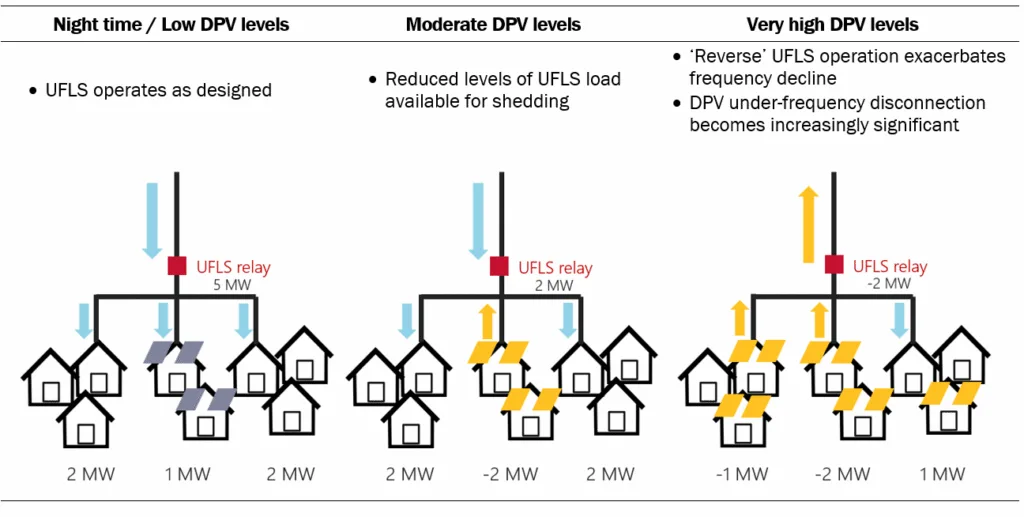
High DPV penetration affects UFLS functionality in three ways:
- Reduction in the amount of net load available for shedding under the UFLS.
- Reverse flows on UFLS circuits. Under these circumstances, the operation of UFLS relays acts to disconnect circuits that are acting as net generators, accelerating frequency decline rather than arresting it.
- Significant proportions of installed DPV systems display under-frequency disconnection behavior. A 2016 survey of DPV manufacturer settings found that approximately 10-15% of currently installed DPV systems disconnect when power system when frequency falls to 49Hz (in Australia, the nominal level is 50 Hz). Disconnection can increase system security risks and exacerbate the size of the original generation loss, leading to further falls in frequency.
Figure 1 summarizes the increasing challenges that high levels of DPV present to UFLS operation.
Figure 1: Growing impacts of DPV on UFLS operation
Case study in South Australia
All three challenges exist in South Australia.
Total UFLS load in the region reached a minimum of 12 MW at 13:36 on 7 November 2020. Figure 2 illustrates the load profile on this day. If a severe disturbance occurred during the minimum period around midday, there would be almost no net load available to trip to arrest a severe frequency decline. Customers would be disconnected, but this would not assist in arresting the frequency decline.
Figure 2: Total net UFLS load in South Australia on 7 November 2020, the day of minimum UFLS load
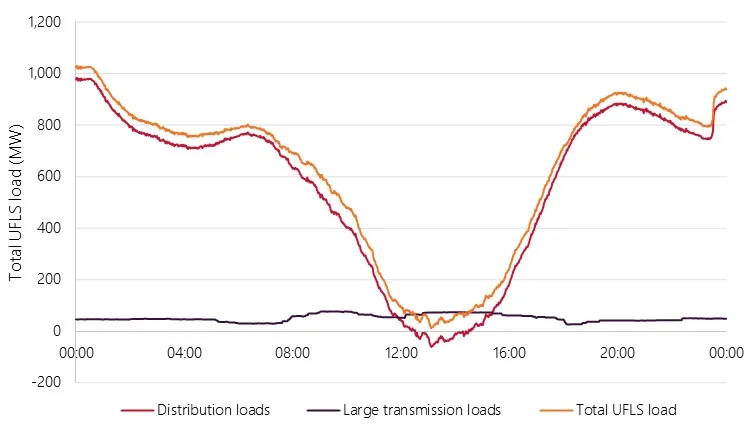
Furthermore, during the period of minimum UFLS load illustrated in Figure 2, approximately half of all UFLS trip frequency bands in the distribution system were in reverse flow. The red line in Figure 2 illustrates the sum of all distribution-connected UFLS loads in the region, showing this was negative for almost two hours near noon, reaching a minimum of -60 MW at around 13:30. This means that the action of UFLS relays to trip those circuits would have actively exacerbated a frequency decline, rather than helping to correct it.
Even further, in this minimum UFLS load period, almost 1,200 MW of DPV was operating in South Australia. It is estimated that 10-15% of older DPV will disconnect based on the inverter protection settings when frequency falls to 49Hz (when UFLS relays start operating), representing an additional generation loss of up to 180 MW. This will add to the size of the original contingency, further increasing the difficulty of arresting the frequency decline.
South Australia is synchronously connected to the rest of the Australian National Electricity Market (NEM) via a single double-circuit interconnector. UFLS is the main line of defence relied on to arrest a frequency decline if this interconnector trips when importing energy into South Australia. If there is insufficient UFLS load to arrest the resulting frequency decline, cascading failure and a black system may result. Over the last decade, South Australia has experienced a non-credible separation approximately once every two years.
What’s being done?
A suite of complementary actions is underway to restore UFLS capability in South Australia:
- Adding new loads to the South Australian UFLS and optimizing UFLS load quantities in each trip frequency band, while respecting the relative sensitivity of essential loads.
- Constraining interconnector imports into South Australia during periods when UFLS load is known to be inadequate to arrest cascading failure following separation.
- Dynamic arming of UFLS circuits in reverse flow, such that the under-frequency tripping action of the UFLS relay will be blocked or disarmed when the circuit is in reverse flows.
Each is discussed in more detail below.
Adding new loads to the UFLS
Network Service Providers and the South Australian Government have identified and added approximately 200 MW of new load to the UFLS across both distribution and transmission networks. An additional ~100 MW is planned to be added in 2021-22.
Constraining interconnector imports
A network constraint has been implemented to limit imports into South Australia to a level where the available UFLS is adequate to manage the double-circuit loss of the interconnector. The constraint calculates allowable interconnector imports in real time based on:
- A real-time SCADA measurement of total UFLS load in South Australia.
- The amount of Fast Frequency Response (FFR) available in South Australia (found to roughly 1:1 offset the need for UFLS).
- The total amount of DPV operating in South Australia.
- The total amount of inertia from large synchronous generators operating in South Australia.
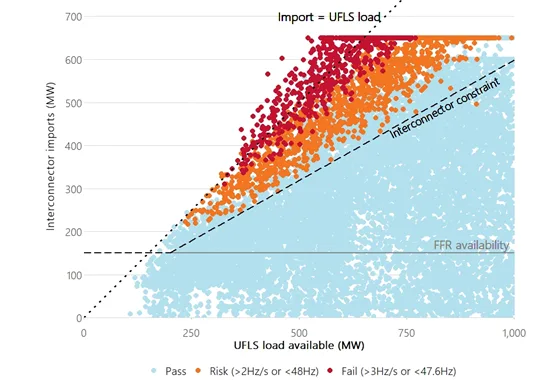
The constraint is illustrated in Figure 3. It acts to maintain interconnector imports in the blue zone, below the zone shown by red and orange dots. Each dot represents a simulation, with varying levels of interconnector imports, inertia in South Australia, UFLS load, and DPV generation. Red dots indicate “fail” scenarios, where a double circuit interconnector loss has a high likelihood of cascading system failure. Orange dots represent “risk” scenarios, where a double circuit interconnector loss has a high risk of complications. Blue dots represent “pass” scenarios, outcomes that meet acceptance criteria. Risks occur when interconnector imports are high (such that the contingency resulting from loss of the interconnector is large), and UFLS load is low. An in-depth discussion of the model used to produce these simulations is found in Appendix A of the 2020 Power System Frequency Risk Review.
Figure 3: Simulation outcomes for the double-circuit loss of the South Australian interconnector
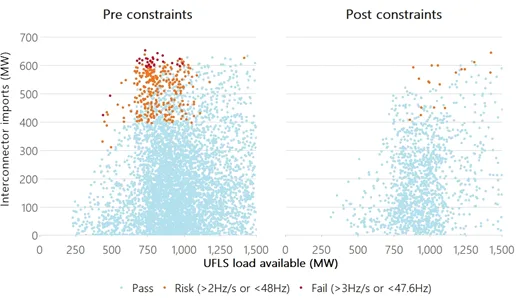
Implemented in October 2020 alongside an update to an existing RoCoF constraint on the interconnector, simulations indicate that the constraints have removed all ‘fail’ conditions and the majority of risk conditions in 2020, as demonstrated in Figure 4.
Figure 4: Simulation outcomes for historical periods since the UFLS constraints were implemented
Dynamic arming of UFLS relays in reverse flow
Dynamic arming involves upgrades to UFLS relays such that they disarm or block tripping when a circuit is in reverse flow. This removes risks of ‘reverse’ operation (where tripping circuits in reverse flow acts to exacerbate the frequency decline), and reduces unnecessary customer disconnection. As DPV continues to grow across South Australia and an increasing number of UFLS circuits move into reverse flow, dynamic arming is a prerequisite to any other action to improve UFLS functionality.
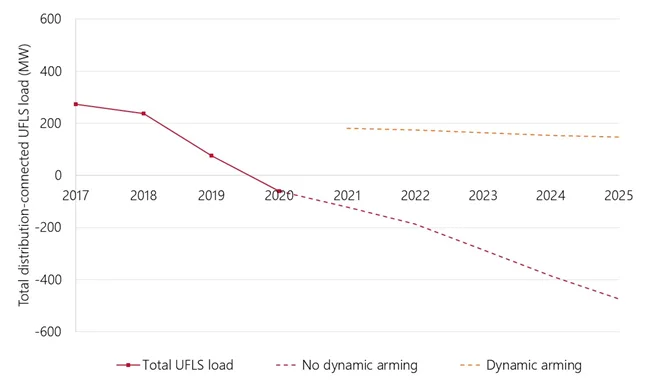
Figure 5 shows historical and forecast levels of UFLS load in the lowest UFLS load interval and demonstrates how dynamic arming restores positive levels of load to the UFLS across all forecast years. Without dynamic arming, UFLS load levels in South Australia could reach levels as low as -470 MW by 2025, with almost all the UFLS trip frequency bands in reverse flow. Dynamic arming can increase UFLS load levels by as much as 620 MW.
Figure 5: Total distribution-connected UFLS load in the minimum UFLS load interval – dynamic arming vs no dynamic arming
In many locations, dynamic arming requires an upgrade or replacement cost. Dynamic arming delivers the highest UFLS load increase for circuits which exhibit high levels of reverse flow or are often in reverse flow. The South Australian rollout aims to target these high-benefit sites first, to deliver most of the load increase while managing costs. The process used to develop the recommended approach for South Australia is described in more detail in the Dynamic arming implementation investigation report.
What’s next?
Based on an analysis of historical generation contingencies and load shedding events, the total amount of load required for proper functioning of the South Australian UFLS is likely in the range 800 to 1,200 MW. The suite of measures currently underway provide foundational support to the UFLS, but are expected to restore UFLS load to 250 MW or less in minimum periods. Additional work is required to ensure sufficient under-frequency emergency response.
Further studies are underway to quantify and evaluate the effectiveness of potential mitigation measures, which include:
- Improvements to inter-regional protection schemes and adjustments to the UFLS constraints, to reduce risks from a range of separation possibilities. These measures will be most important over the coming few years, until a recently approved second interconnector that links South Australia to another NEM region reduces separation risks.
- Rebalancing and adjustments to the South Australian UFLS scheme to optimise scheme effectiveness and enhance its performance in facilitating frequency recovery.
- Options for moving UFLS trip devices to the customer site level, facilitating separation of customer load and distributed generation.
- Exploration of emergency under-frequency response from other sources, such as FFR from batteries, curtailed solar farms, or others.
With its high DPV penetration and relatively low levels of large industrial load, South Australia is a forerunner for a range of operational challenges that arise from DER integration. Reductions in daytime UFLS load and reverse flow on UFLS circuits are already emerging in other NEM regions, and measures implemented in South Australia are likely to be taken up across Australia and in other jurisdictions with high levels of DPV. As DPV continues to be installed and the grid operates in increasingly new territory, the emergency safety net that the UFLS provides is more important than ever before.
Daena Ho & Dr. Jenny Riesz
Australian Energy Market Operator