
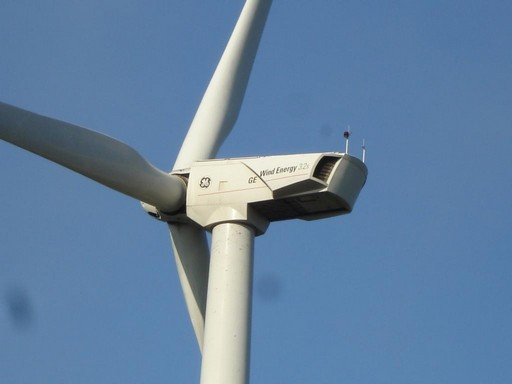
GE’s 1.5 MW series is represented by three-blade, upwind, horizontal axis wind turbines with a rated capacity of 1.5-megawatts. Three different models represent the 1.5 MW series – 1.5se, 1.5sle, and 1.5xle.
The rotor on a GE 1.5 MW turbine is designed to operate in an upwind configuration at 10 to 20 revolutions per minute (rpm). Rotor speed is regulated by a combination of blade pitch angle adjustment and generator/converter torque control. The 1.5 MW series provides the option of a selectable power factor between 0.95 (overexcited) and 0.90 (underexcited) and also a VAR boost, which will override watts production to deliver more VARs during emergency under-voltage conditions.
 |
|
| Power Regulation | Active blade pitch control |
|---|---|
| Operating Data | |
| Rated Power | 1500 KW [1] |
| Cut-in wind speed | 3.5 to 4 m/s (8 to 9 mph) |
| Cut-out wind speed | 20 to 25 m/s (45 to 55 mph) |
| Cut-back-int wind speed | 17 to 22 m/s (38 to 49 mph) |
| Wind Class | IEC TC III+; IEC TC IIA; IEC TC IIB; IEC TC Ib |
| Rotor | |
| Rotor diameter | 70.5 m (231 ft) for the 1.5se, 77 m (253 ft) for the 1.5 sle, and 83 m (271 ft) for the 1.5xle model. |
| Operational interval | 10.1 – 22.2 rpm |
| Towers | |
| Type | Tubular steel tower |
| Hub heights | 65 m (212 ft) to 80 m (262 ft) |
| Generator | |
| Type | Doubly fed asynchronous generator |
| Nominal output | 1,500 kW |
| Operational data | 690 V (50 Hz/60 Hz) |
| Gearbox | |
| Type | Three-step planetary/helical gear system with a ratio of gear 1:72 (60 HZ) |
Contents
Vendor Specific Model Characterization
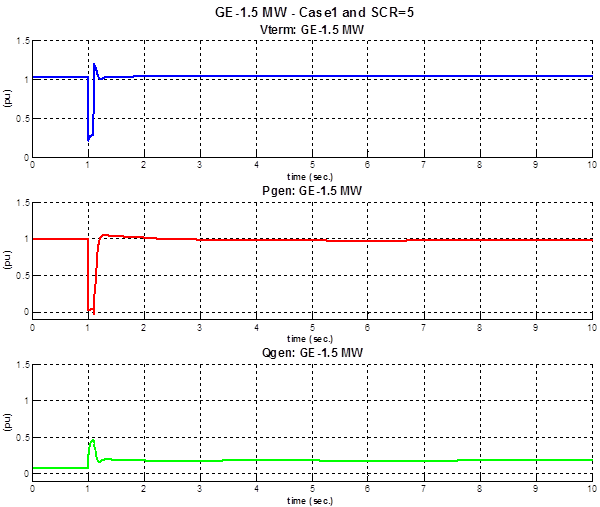
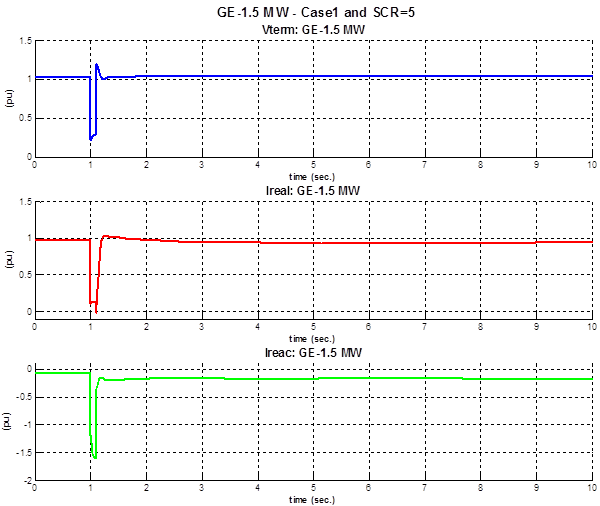
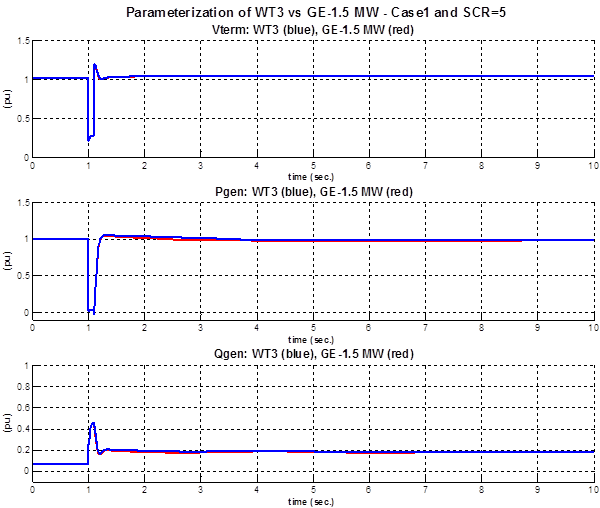
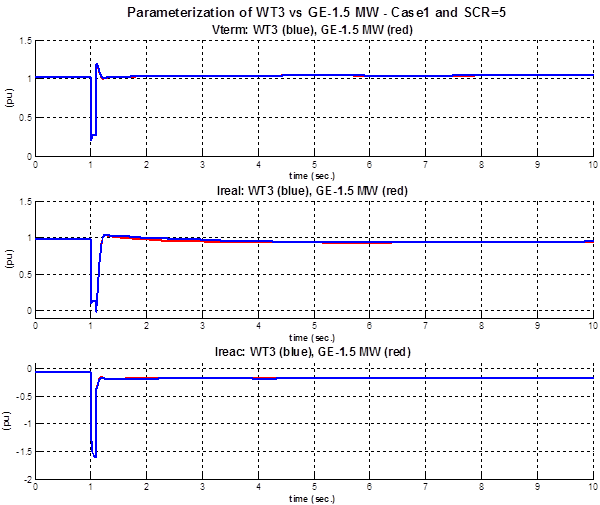
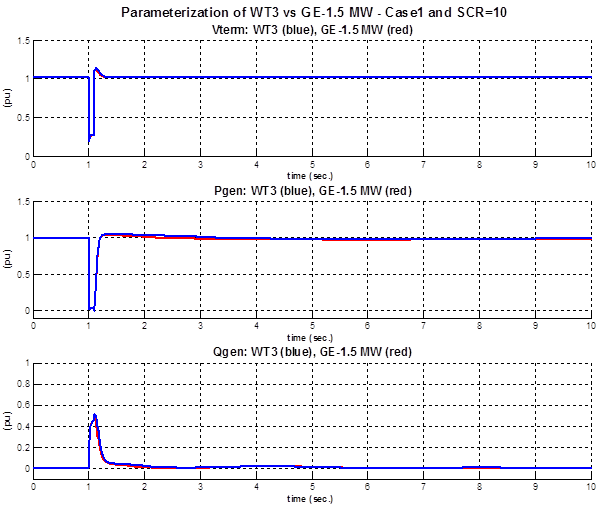
Model Performance: Case 1 – Fault Event
In this case a remote fault is applied to bus 12 for a duration of 6 cycles (0.1 sec).
GE-1.5 MW – Case 1 and SCR=5
GE-1.5 MW – Case 1 and SCR=10
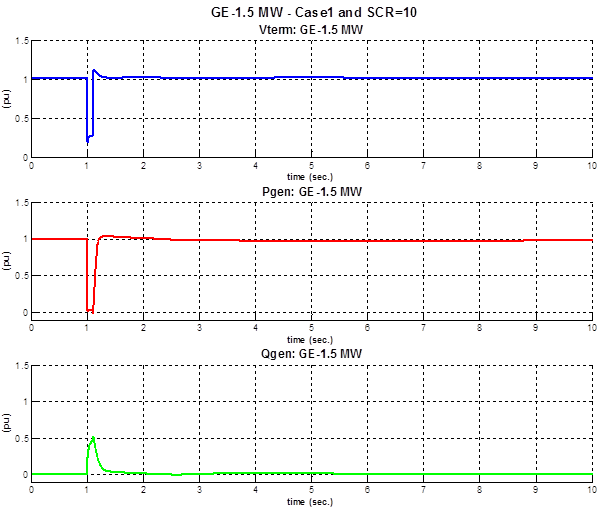
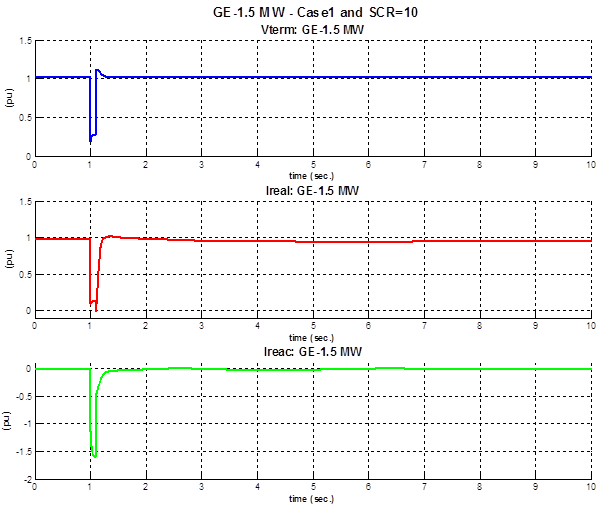
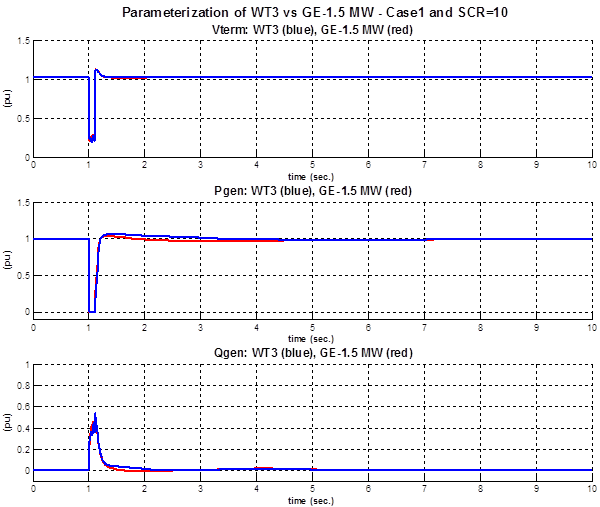
For both SCR settings the reactive power output of the WTG is at or near its maximum during the fault in an effort to regulate voltage. After the fault is removed and the rated voltage level is restored, the reactive power returns to its steady state condition.
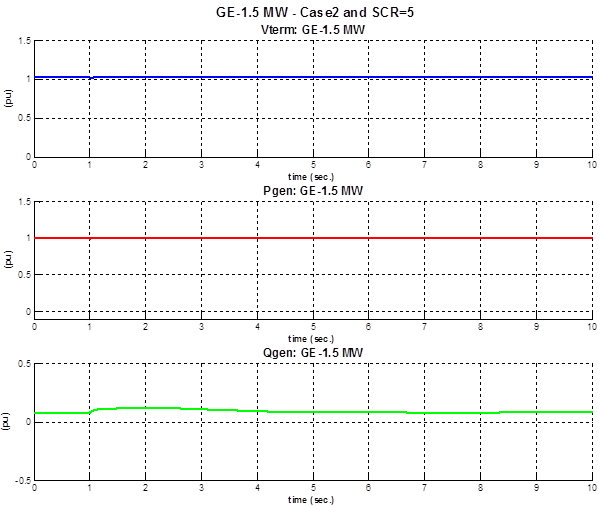
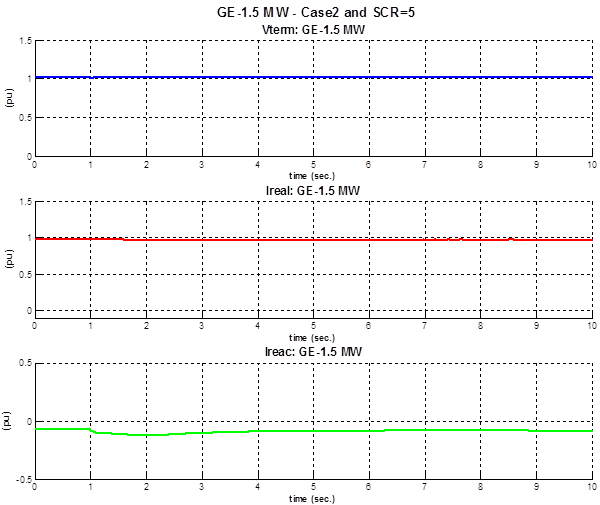
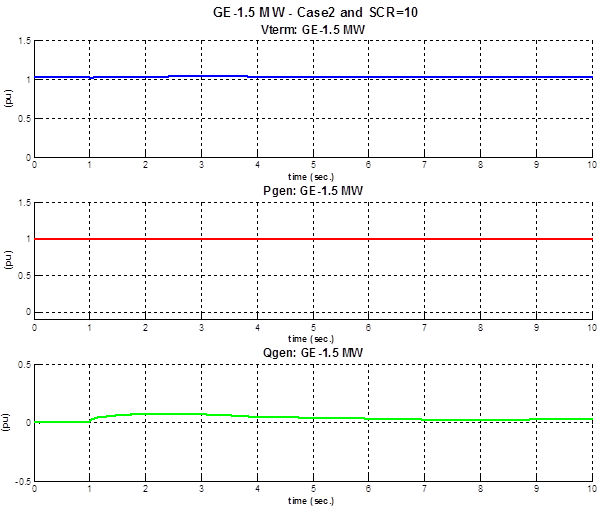
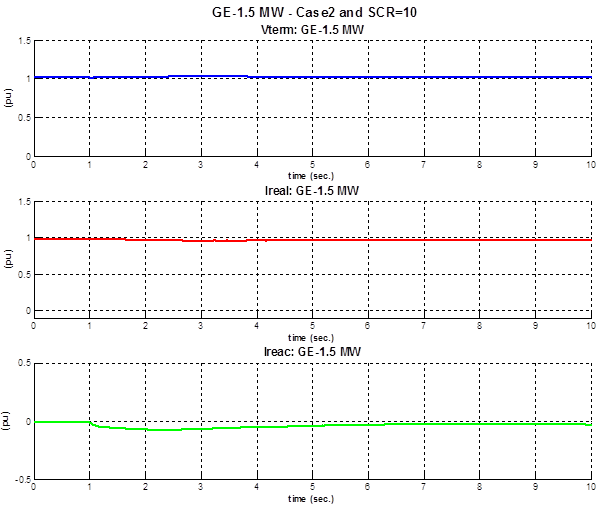
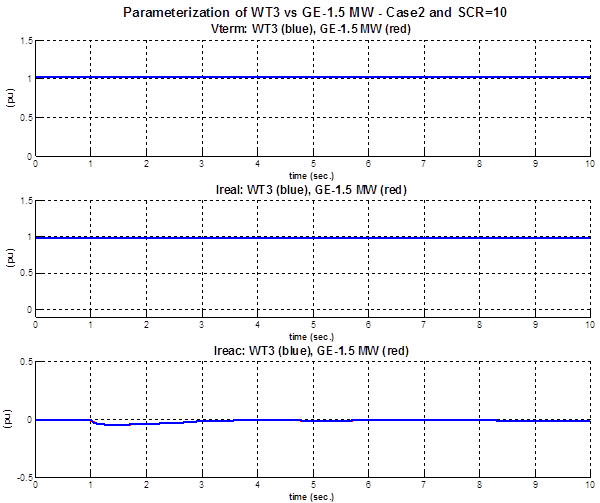
Model Performance: Case 2 – Under-Frequency Event
In this case a under frequency event is created by tripping the 100 MVA generation unit at bus 20.
GE-1.5 MW – Case 2 and SCR=5
GE-1.5 MW – Case 2 and SCR=10
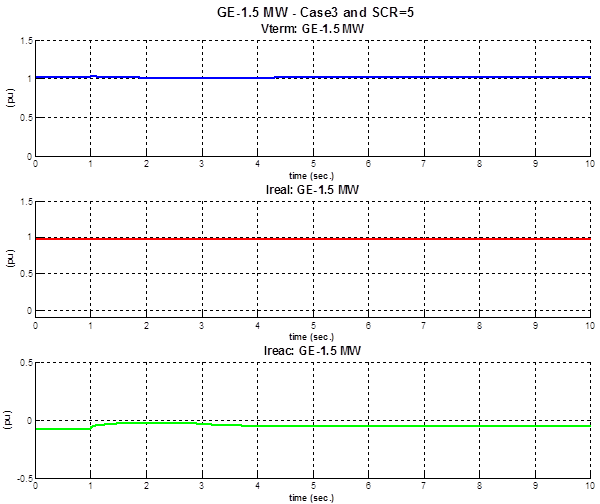
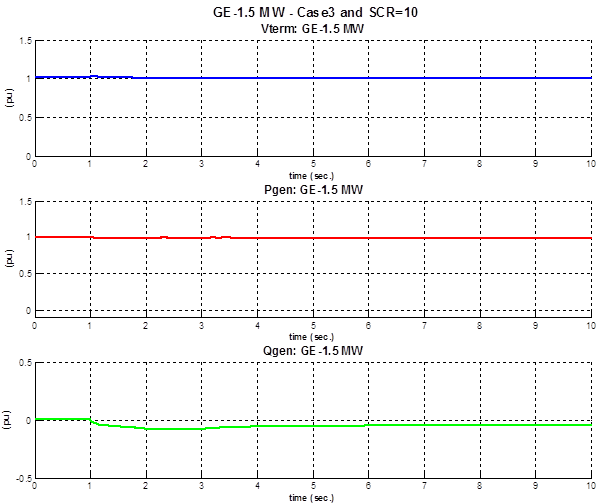
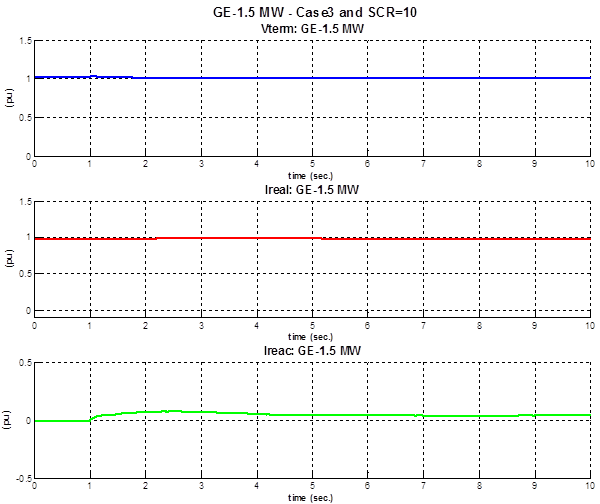
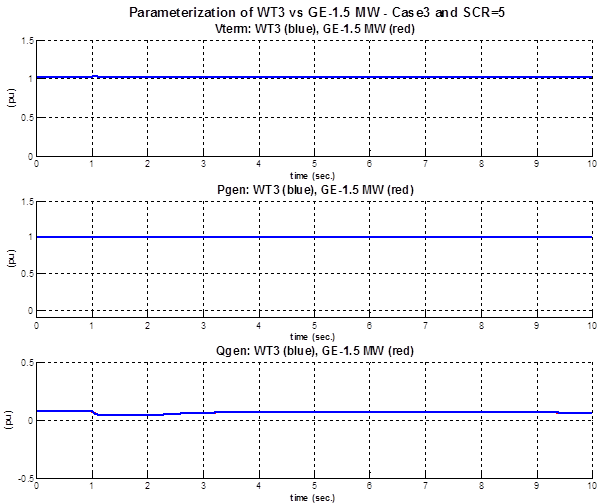
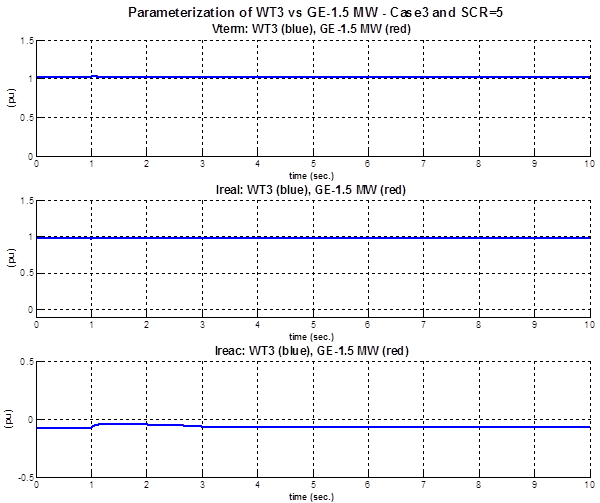
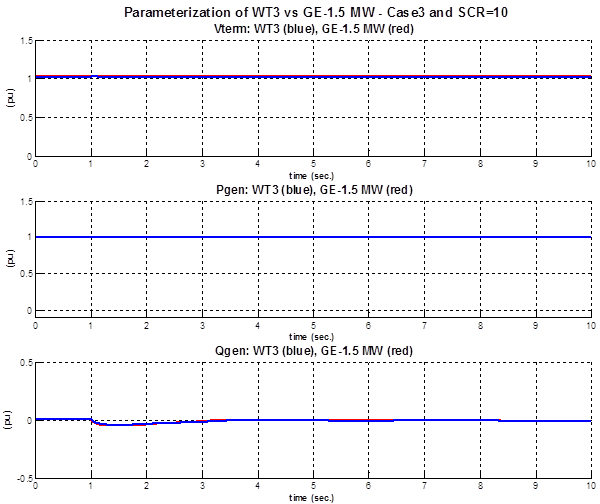
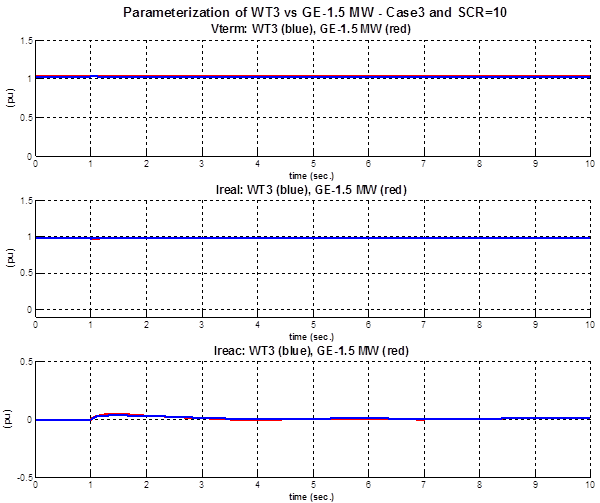
Model Performance: Case 3 – Over-Frequency Event
In this case a under frequency event is created by tripping the 100 MVA load at bus 11
GE-1.5 MW – Case 3 and SCR=5
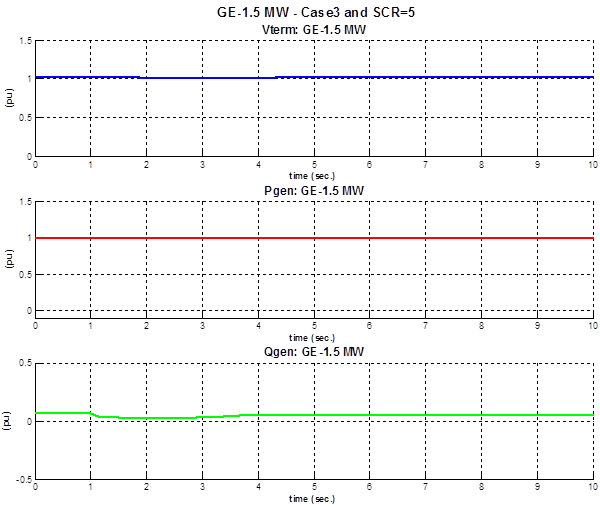
GE-1.5 MW – Case 3 and SCR=10
Generic Model Parameterization – PSLF Environment
The parameter values shown in the table resulted from a compromise between the simulated cases (i.e. SCR 5 and SCR 10) and network conditions (i.e. fault, under- and over frequency)
|
There are four generic wind turbine models in PSLF for a type 3 wind turbine (WT3). These models are wt3g, wt3t, wt3e and wt3p. The wt3g model includes the generator and converters dynamics. The wt3t model includes the wind aerodynamic model and the single or double mass shaft compliance model. The wt3p includes the pitch controller model. Finally, the wt3e model contains the real and reactive control models. The values for the parameters resulted from a compromise between the two cases (SCR 5 and SCR 10). The set of parameters had to be tuned to satisfactory match the results of dynamic simulation for the VSM and the generic WT3 model for both SCR cases. | |||||||||||||||||||||||||||||||||||||||||||||||||||||||||||||||||||||||||||||||||||||||||||||||||||||||||||||||||||||||||||||||||||||||
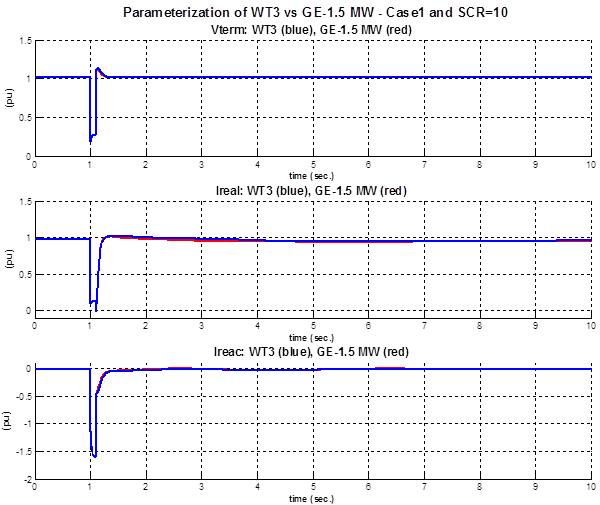
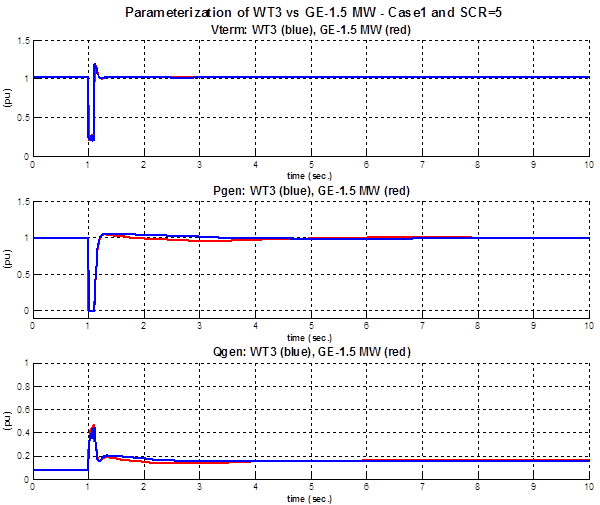
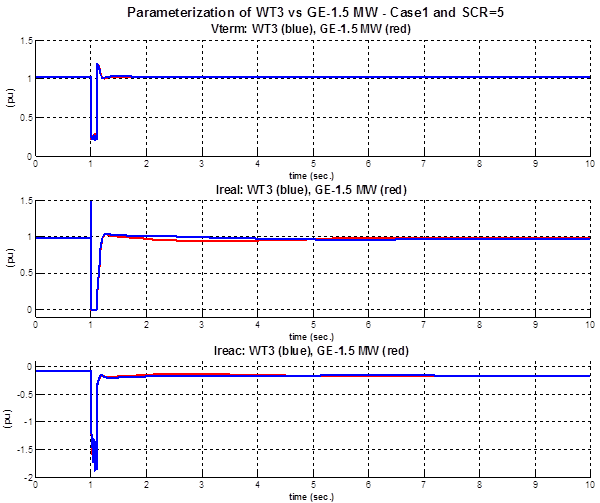
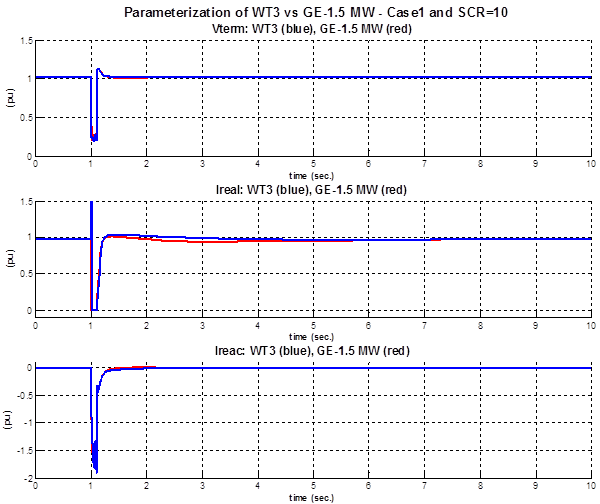
Parameterization: Case 1 – Fault Event
Parameterization of WT3 vs GE-1.5 MW – Case 1 and SCR=5
Parameterization of WT3 vs GE-1.5 MW – Case 1 and SCR=10
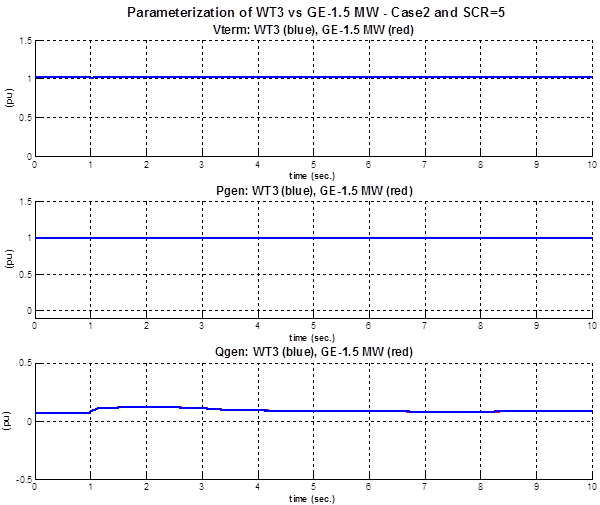
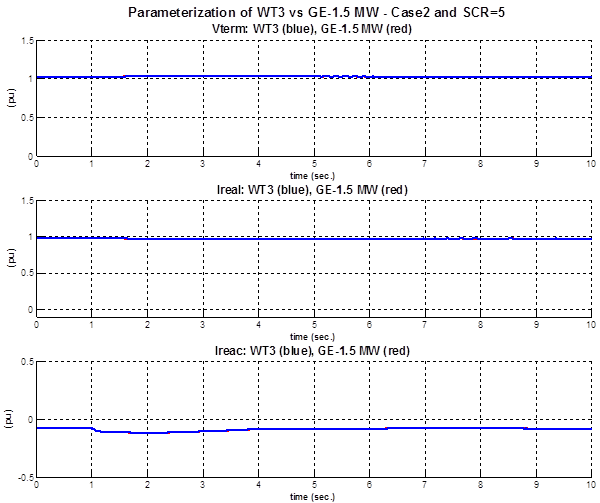
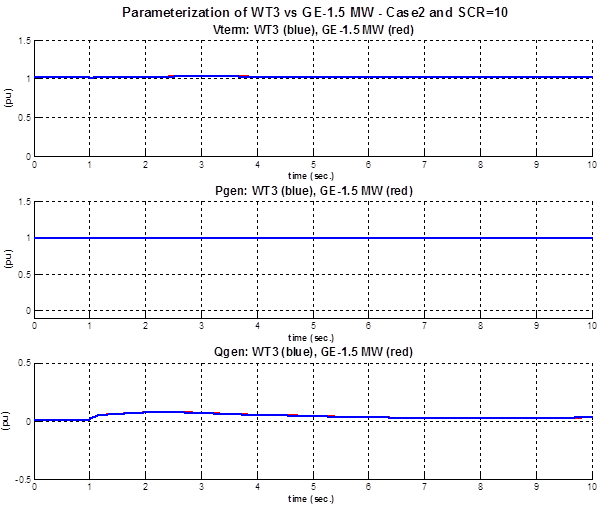
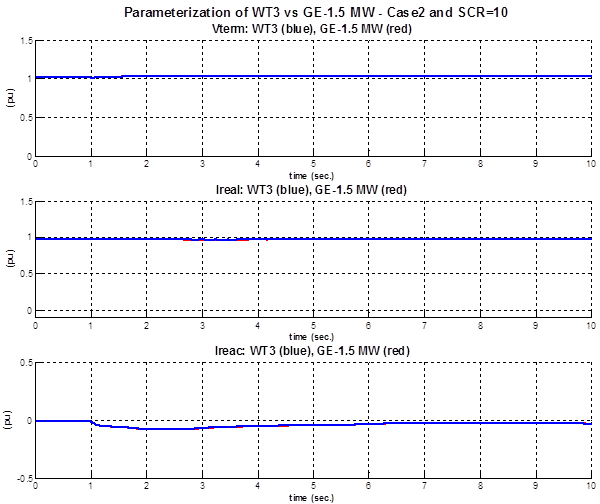
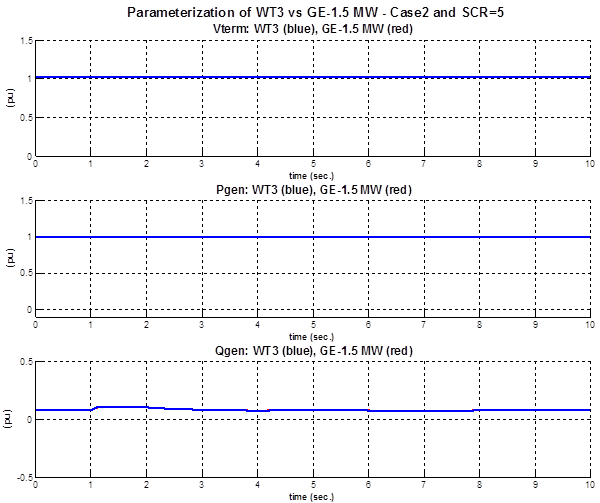
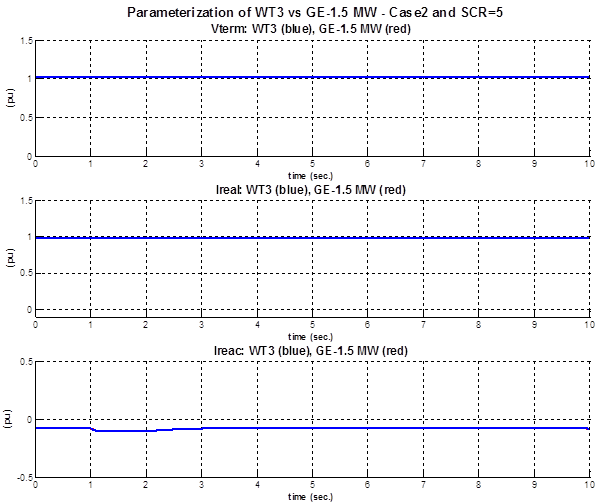
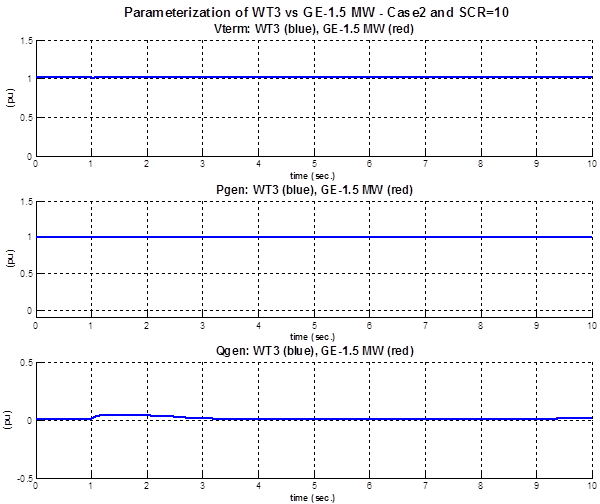
Parameterization: Case 2 – Under-Frequency Event
Parameterization of WT3 vs GE-1.5 MW – Case 2 and SCR=5
Parameterization of WT3 vs GE-1.5 MW – Case 2 and SCR=10
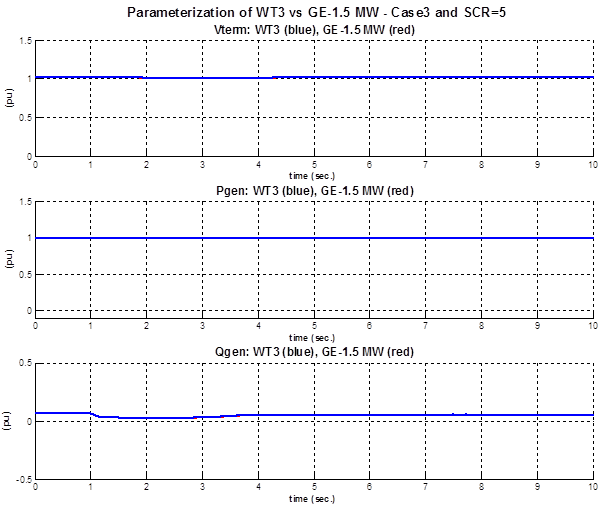
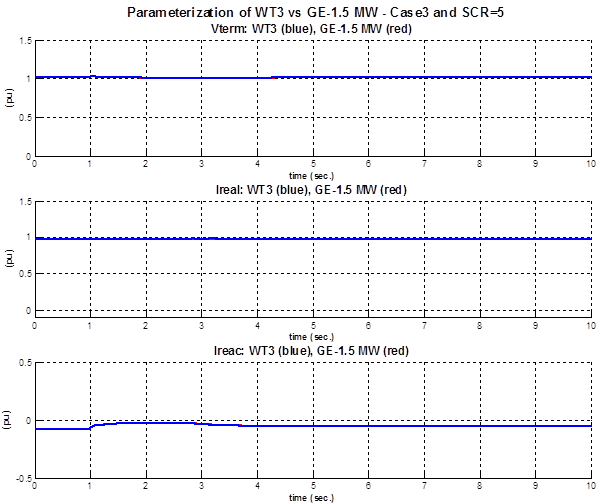
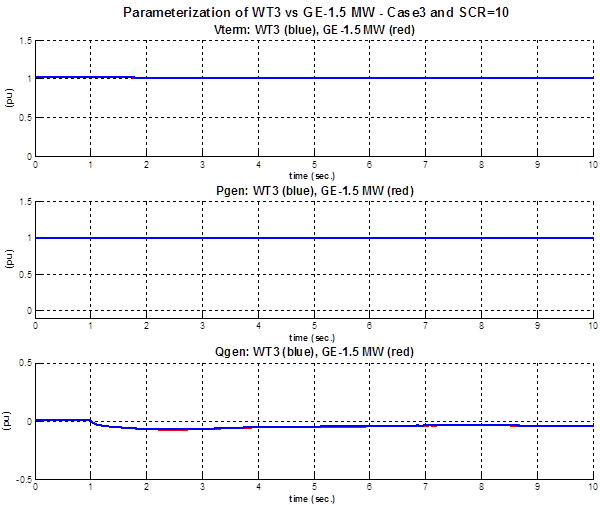
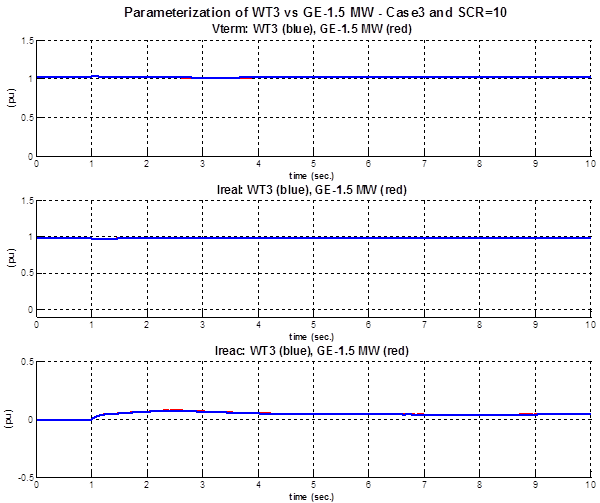
Parameterization: Case 3 – Over-Frequency Event
Parameterization of WT3 vs GE-1.5 MW – Case 3 and SCR=5
Parameterization of WT3 vs GE-1.5 MW – Case 3 and SCR=10
Generic Model Parameterization – PSSE Environment
The parameter values shown in the table resulted from a compromise between the simulated cases (i.e. SCR 5 and SCR 10) and network conditions (i.e. fault, under- and over frequency).
|
There are four generic wind turbine models in PSSE for a type 3 wind turbine (WT3). These models are WT3G1, WT3T1, WT3E1 and WT3P1. The WT3G1 model includes the generator and converters dynamics. The WT3T1 model includes the wind aerodynamic model and the single or double mass shaft compliance model. The WT3P1 includes the pitch controller model. Finally, the WT3E1 model contains the real and reactive control models. The values for the parameters resulted from a compromise between the two cases (SCR 5 and SCR 10). The set of parameters had to be tuned to satisfactory match the results of dynamic simulation for the VSM and the generic WT3 model for both SCR cases. | |||||||||||||||||||||||||||||||||||||||||||||||||||||||||||||||||||||||||||||||||||||||||||||||||||||||||||||||||||||||||||||||||||||||||
Parameterization: Case 1 – Fault Event
Parameterization of WT3 vs GE-1.5 MW – Case 1 and SCR=5
Parameterization of WT3 vs GE-1.5 MW – Case 1 and SCR=10
Parameterization: Case 2 – Under-Frequency Event
Parameterization of WT3 vs GE-1.5 MW – Case 2 and SCR=5
Parameterization of WT3 vs GE-1.5 MW – Case 2 and SCR=10
Parameterization: Case 3 – Over-Frequency Event
Parameterization of WT3 vs GE-1.5 MW – Case 3 and SCR=5
Parameterization of WT3 vs GE-1.5 MW – Case 3 and SCR=10
Results Validation
In all figures, the response of the generic model matches the response of the VSM in the frequency range of interest. Thus, both the PSLF and the PSSE models are an appropriate representation of the GE 1.5 MW WTG’s behavior for fundamental frequency analysis.
Vendor Specific Model Validation
The dynamic performance of the voltage and reactive power at the POI of a WPP for a capacitor switching event is documented in this short section. Field test measurements are compared against the VSM PSLF GE 1.5 WTG model and a parameterized Generic Type III WTG model. The figures show a close match between the simulated variables and their corresponding measurements and validate the feasibility of using a generic model for the system and event studied.
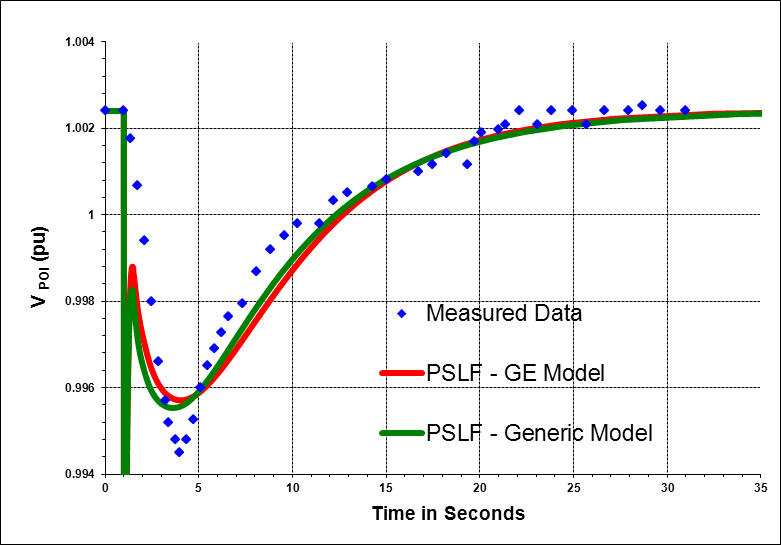
POI Voltage – test measurements vs. GE-VSM and Generic Type III simulations
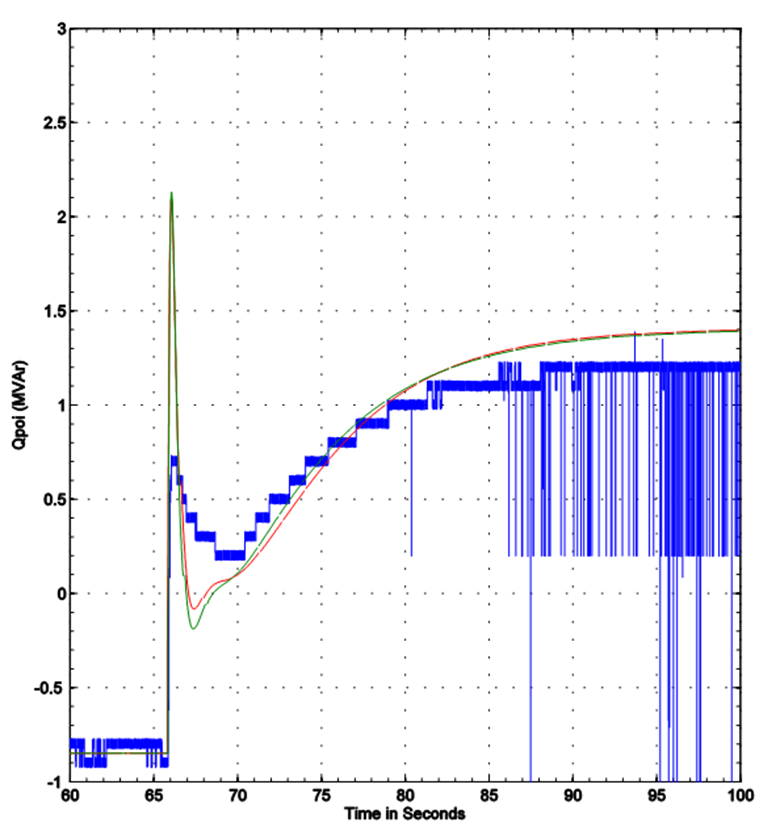
POI Reactive Power – test measurements (blue) vs. GE-VSM (red) and Generic Type III (green) simulations