
Author: WECC REMTF[1]
A large amount of PV generation is projected to be installed in the Western Interconnection in the form of distribution-connected commercial or residential installations, and transmission-connected large-scale plants. There is wide consensus that representation of PV systems in large-scale simulations needs to be improved to capture the potential effect on local areas as well as the overall system. The Modeling and Validation Work Group (MVWG) of the Western Electricity Coordinating Council (WECC) recently expanded the scope of its Renewable Energy Modeling Task Force (REMTF) to address modeling of PV systems.
This article contains technical guidelines issued by REMTF for representation of distribution-connected and transmission-connected photovoltaic plants for bulk-system load flow simulations in WECC. Although the intention is to address NERC MOD standards for regional planning, portions of these guidelines may also be considered for interconnection studies. The REMTF is currently working on generic positive-sequence dynamic models for PV plants, including transmission-connected and distribution-connected. A separate REMTF document covering dynamic representation covers these topics.
Contents
Representation of PV Systems in Bulk System Studies
Central Station PV Systems
The WECC Data Preparation Manual states that single generating units 10 MVA or higher, or aggregated capacity of 20 MVA connected to the transmission system (60kV and above) through a step-up transformer(s) should be modeled as distinct generators in WECC base cases. It also states that collector-based system such as wind or solar plants connected to the transmission grid may be represented as an equivalent generator, low voltage to intermediate voltage transformer, equivalent collector circuit, and transformer, as recommended by REMTF’s WECC Wind Power Plant Power Flow Modeling Guide.
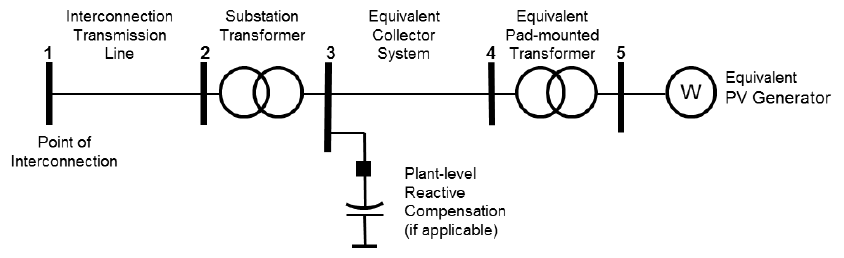
Because of similarities in the internal topology of central station photovoltaic (PV) plants and wind plants, the guidelines contained in this article are very similar to a previously issued guide for wind power plants. REMTF recommends the use of the single-machine equivalent representation to model central-station PV plants in WECC base cases. This representation is also considered adequate for positive-sequence transient stability simulations at the bulk system level. If present, the interconnection transmission line, station transformer(s) and plant-level reactive compensation should be represented explicitly, according to established industry practice.
In this model, the equivalent generator represents the total generating capacity of all the inverters, the equivalent pad-mounted transformer represents the aggregate effect of all step-up transformers, and the equivalent collector system branch represents the aggregate effect of the PV plant collector system. With the proper model parameters, this model should approximate PV plant load flow characteristics at the interconnection point, collector system real and reactive losses and voltage profile at the terminals of the “average” inverter in the PV plant.
As with any other model, the single machine representation has some limitations. Due to collector system effects, terminal voltage of individual inverters could vary somewhat, especially in very large PV plants where the electrical distance between inverters may be significant. Inverters that are closest to the interconnection point may experience significantly different terminal voltage compared to inverters that are electrically farthest from the interconnection point. In actual operation, terminal voltage of some inverters may reach control or protection limits, resulting in different terminal behavior, or tripping. During the design stage, or in special cases, it may be reasonable to use a more detailed representation of the collector system to capture these details. However this type of detail usually is not feasible for large-scale simulations.
The following guidelines should be considered to model each of the components of the PV plant single-machine equivalent representation.
Interconnection Transmission Line
Standard data includes nominal voltage, positive-sequence line parameters (impedance and charging) and line rating.
PV Plant Station Transformer
Transmission-connected PV plants require a station transformer. It should always be represented explicitly. Standard data includes transformer nominal voltage of each winding, impedance, tap ratios, regulated bus and set point, and ratings. Positive-sequence impedance for station transformers is in the range of 6% to 10%, and X/R ratio in the range of 20 to 50.
Plant Level Reactive Compensation
PV plants could have station fixed and/or switched capacitors installed at collector system. If present, shunt capacitors should be modeled as constant impedance devices in load flow, to capture voltage-squared effects. The WECC Data preparation Manual states that each switched capacitor should be modeled explicitly. Standard data includes nominal rating, impedance, and controlled device, if applicable. Operation of the shunt devices is coordinated with the plant-level reactive controller (see equivalent generator representation).
Equivalent Collector System
Central-station PV plants collector systems consist of one or more medium voltage underground feeders. Factors considered in feeder design include cost, real power losses, and voltage performance. A typical design goal is to keep average real power losses below 1%. At full output, real power losses can be higher, as much as 2% to 4%. The collector system network is typically underground. For that reason, the equivalent collector system X/R ratio tends to be low compared to typical overhead circuits. The equivalent collector system impedance tends to be small compared to the station transformer impedance, but is not insignificant.
A simple method developed by NREL can be used to derive equivalent impedance (Zeq) and equivalent susceptance (Beq) of a collector system consisting of radial elements.[2] The computation is as follows:
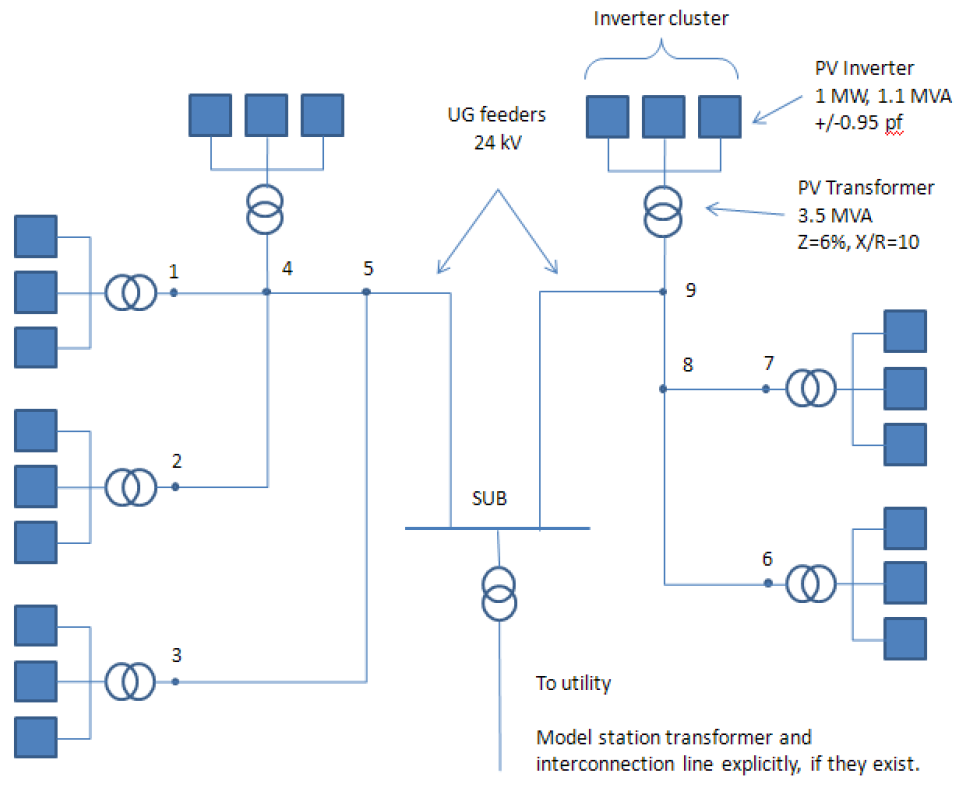
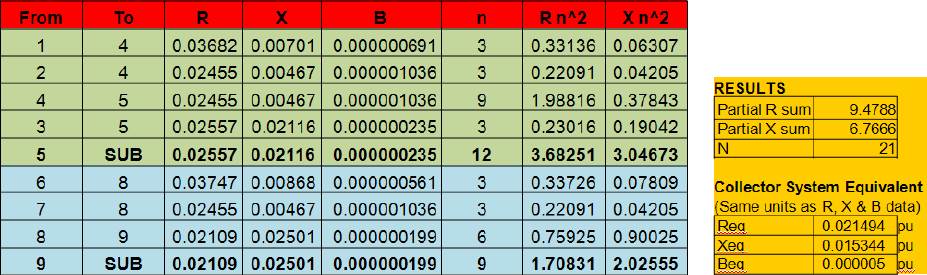
\(Z_{eq} = R_{eq}+jX_{eq}=\cfrac{\sum_{i=1}^I Z_in_i^2}{N^2}\) \(B_{eq} = \sum_{i=1}^I B_{i}\)where I is total number of branches in the collector system, Zi and ni are the impedance (Ri + jXi) for ith branch, and N is the total number of inverters in the PV plant. Branch impedance data can be obtained from collector system design (conductor schedule) for the project. As stated before, the equivalent impedance computed in this manner approximates real and reactive losses seen by the “average inverter” in the PV plant. This calculation can be easily implemented in a spreadsheet. Figure on the right shows a simple example with nine branches (I = 9), and 21 inverters (N = 21). The corresponding calculations are shown bellow. In this example, the inverters are 7 clusters of 3 inverters. In general, larger PV power plants would have lower Zeq and higher Beq considering that more parallel feeders would be required.
Equivalent PV Plant Step Up
A PV large plant has several pad-mounted transformers, each connected to one or more PV inverters. Assuming that all step-up transformers are identical, and each connects to the same number of inverters, the per-unit equivalent impedance (ZTeq) and the equivalent MVA rating (MVATeq) can be computed as follows:
\(Z_{Teq} = Z_T\) \(MVA_{Teq} = N \times MVA_T\)In these equations, ZT is the impedance of one transformer on its own MVA base (MVAT). For the example system discussed above, the equivalent transformer impedance would be 6% on a 21 MVA base (7 X 3 MVA), with an X/R ratio of 10. If there are different transformer sizes or a different number of inverters are connected to each transformer, the method shown bellow can be applied to calculation of the equivalent transformer impedance. Step-up transformers associated with utility-scale PV plants are in the range of 500 kVA to 2 MVA, and have impedance of approximately 6% on the transformer MVA base, with X/R ratio of about 8.
Equivalent PV Generator Representation
_at_nominal_voltage.png)
For load flow simulations, the equivalent PV generator should be represented as a standard generator, as opposed to a negative load. Active power level and reactive power capability must be specified according to the guidelines below.
- Active Power Output Level
PV plant output varies as a function of solar input and, to a lesser extent, temperature. Typically, PV plants are designed to achieve full output for several hours of the day under clear sky conditions. The real power level assumed for the PV plant depends on the purpose of the study. In the context of an interconnection study, a PV plant would be modeled at full output. For other studies, PV plants may be modeled at partial output or zero output. For instance, WECC off-peak cases correspond to nigh-time periods, when PV output is zero. Heavy summer scenarios typically correspond to mid afternoon peak load periods, when PV is likely to be near 100% of output. For regional transmission planning studies, it is recommended that the power level be established based on the average expected output level during the time frame of interest.
- Reactive Power Capability
Interconnection requirements and performance standards addressing reactive power capability from large PV systems are still evolving. Distribution-connected PV systems at generally operated at unity power factor over their entire active power output range. Most inverters designed for residential and commercial applications are not sized to provide any reactive current at full output. However, PV inverters used in utility-scale PV systems often have the capability to provide reactive support at full active power or at partial output. The reactive power capability could be higher at lower active output levels, depending on inverter current limits and depending on grid voltage conditions. The reactive capability curves for inverters differ from those of synchronous machines because they are normally limited by internal voltage and current constraints. Inverters are typically designed for operation from 90% to 110% of rated terminal voltage, and these voltage limits greatly affect the actual reactive power capability. When terminal voltage is 110%, no additional reactive power can be injected into the grid. As stated previously, interconnection standards for PV systems are evolving, and reactive power capability is one of the key areas of discussion. However, some interconnection standards being applied to transmission-connected PV describe reactive capability requirements as a “triangular”, “rectangular” or similar reactive capability characteristic.
These reactive curves are generally valid for nominal voltage only, considering the terminal voltage limits discussed above. It is technically possible to design PV inverters to provide reactive support even if solar input is zero, much like a STATCOM. At the plant level, it should be taken into account that a portion of the inverters in the plant may be turned off at low power output, resulting in a reduction of reactive capability.
When required, the power factor of individual inverters can be adjusted via a plant-level reactive controller to meet operating requirements at the point of interconnection. Several control modes are possible:
- Closed-loop voltage control – Maintain voltage schedule within the reactive power capability of the PV plant, over a certain range of real power output. A small voltage hysteresis or dead band may be appropriate in some situations. For instance, the requirement may be to regulate voltage at the interconnection point within 1% or 2% of schedule.
- Voltage droop control – Increase or decrease reactive power output linearly, as a function of voltage. This type of control allows the PV plant to provide voltage support while avoiding large reactive power swings that a small PV plant would see when connected to a relatively strong transmission system. A small dead band may be implemented.
- Power factor control – Maintain power factor at the interconnection point close to a specified level. For instance, the requirement may be to maintain power factor between 0.98 lead and unity at the interconnection point.
- Reactive power control – Maintain reactive power flow within some specified limits. For instance, the requirement may be to limit reactive power flow at the interconnection point to 5 or 10 MVAr, in either direction.
Representation of reactive power capability of the equivalent inverter depends on the reactive range of the inverters, and how that range is utilized in operations. For example, the equivalent generator for the sample system would have a nameplate rating of 21 MW (21 × 1 MW) and 21.21 MVA (21 × 1.1 MVA). If the inverters participate in steady-state voltage control, then the equivalent generator should be modeled with a reactive range of +/- -0.95 power factor, which corresponds to setting Qmin and Qmax of -6.9 MVAr and +6.9 MVAr, respectively. If the inverters operate at a fixed power factor, then the equivalent generator should have Qmin = Qmax at the corresponding power factor level. At an output level below rated, the reactive limits should be adjusted according to the inverter reactive capability that is programmed into the controls, and the effect of system voltage.
Representation of Distribution-Connected PV Systems
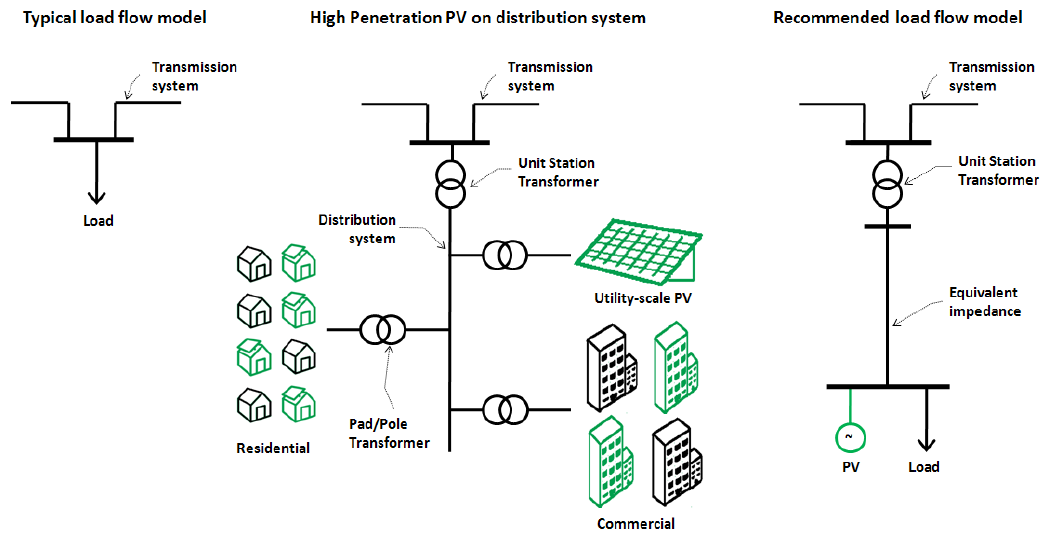
In some ways, representation of distribution-connected PV systems in bulk system studies is more challenging. In WECC base cases, the distribution system is not typically represented and the load, along with embedded distributed generation, is typically lumped at the transmission level. There is increasing industry consensus that distributed generation should be represented more explicitly to the extent that the penetration level is sufficiently high to affect bulk system performance. Representing PV generation and other distributed generation explicitly would allow for proper load scaling and would give planners the ability to account for existing and emerging performance standards applicable to distributed generation, including anti-islanding, voltage tolerance envelope and reconnection, and reactive support, which may be of interest to study future deployment scenarios. In general, distribution-connected PV systems should be represented in bulk system studies to the extent that the aggregate generation has the potential to affect grid reliability and compliance with NERC system performance criteria at the local level. In this regard, the present version of the WECC Data Preparation Manualstates that, when aggregated generation exceeds 10 MVA at any load bus, it should not be netted. Further, the WECC Data Preparation Manual states that total netted generation in an area should not exceed five percent of the area total generation.
The following REMTF technical recommendations apply to modeling of PV systems when the amount of PV generation exceeds the threshold established by the WECC Data Preparation Manual, as amended. In some urban areas, significant generation capacity being developed in the form of large commercial-scale PV systems. Based in their size and their ability to potentially contribute to steady-state reactive power support, it is recommended that these systems be represented with a discrete lumped model with an equivalent LTC transformer and equivalent series impedance representing the impedance of the feeder, service transformer, and secondary network. A similar approach could be used for high penetration residential PV systems. The goal should be to capture the effect of reactive support as well as the voltage tolerance characteristics of PV systems in steady-state simulations, particularly voltage stability. While load modeling is out of the scope of this guide, the importance of properly representing the load, especially its voltage dependency, should be noted. In general, it would be good modeling practice to represent the load behind an equivalent feeder impedance, and use a ZIP or other suitable model to capture the voltage dependency. As stated before, the WECC REMTF is currently working on recommendations for dynamic simulation of transmission-connected and distribution-connected of PV system. Dynamic modeling considerations may affect how distribution-connected PV systems are represented in load flow.
Typical load flow data for the equivalent distribution feeder is shown in table below. Transformer impedances are on the transformer self-cooled MVA base, which should be appropriate for the amount of load served. The feeder impedance is on 100 MVA, 12.5 kV base. The feeder impedance data should be adjusted depending on the load level to obtain a reasonable voltage drop from the station transformer secondary to the typical utilization point, or approximately three percent.
| R, pu | X, pu | |
|---|---|---|
| Station transformer impedance, pu on transformer self-cooled MVA base | 0 | 0.1 |
| Equivalent feeder, service transformer and secondary impedance, pu on 100 MVA, 12.5 kV base | 0.1 | 0.1 |
Modeling during post transient power flows
Modeling of PV generation and reactive compensation components should be consistent with WECC post-transient methodology. Control devices that can complete switching or operation within 3 minutes (e.g., SVCs, STATCOMS and shunts under automatic control) should not be blocked. Devices that require operator action should be blocked. The equivalent WPP generator should have the Load Flag set to “1” to reflect the fact that the output should not change during a governor power flow.
Model Validation
Single-machine equivalent model parameters can be derived from preliminary data, as discussed in this guide. Preliminary data should be replaced with as-built data when such data becomes available, certainly after commissioning. Load flow model data, particularly reactive power capability, should be validated from time to time by direct test or with actual operating data, consistent with WECC and NERC requirements and methodologies. As of the date this guide was written, specific testing and model validation guidelines for PV plant have not been adopted for use in WECC.
References
- ↑ WECC REMTF,WECC Guide for Representation of Photovoltaic Systems In Large-Scale Load Flow Simulations, August 2010, [Online]. Available: https://www.wecc.biz/Reliability/WECC%20PV%20Plant%20Power%20Flow%20Modeling%20Guidelines%20-%20August%202010.pdf. [Accessed June 2015].
- ↑ E. Muljadi, A. Ellis, et al, “Equivalencing the Collector System of a Large Wind Power Plant”, IEEE Power Engineering Society Annual Conference, Montreal, Quebec, June 12-16, 2006.