Any time you happen to glance at the electricity mix in the United States you will notice a significant transition taking place. Wind and solar power plants are being constructed and activated at an ever-increasing rate. In fact, according to the Federal Energy Regulatory Commission (FERC), in the next three years the United States could deploy more wind and solar than are currently in service on the grid today. This could effectively double the capacity of wind and solar in just three years with new plants that are more efficient.

Christopher Clack
Simultaneously, the penetration of distributed solar is increasing dramatically, with each passing month seeing more panels going into service. Surely all these distributed solar projects are a distraction and make the cost of the whole system higher, while being inefficient in terms of solving climate change, right? Well, no! Vibrant Clean Energy recently released a study (see summary) that might finally “break the fever” of that thinking.
Modeling Background
First, some background: the electricity industry relies on modeling to help inform its thinking. This is a very helpful thing; however, outdated modeling techniques, which are consequences of legacy needs and computing, are increasingly causing discrepancies between experience drawn from deployments and conclusions made from these simulations.
To tackle this problem, next-generation models have been created, and more are being built every day. These new models should include, at a minimum, much more data (especially for wind and solar, requiring high spatial granularity), describe electricity storage more endogenously (requiring high temporal granularity), and solve over large geographic footprints (requiring huge datasets) to determine the interactions of connected regions.
Frustratingly, these next-generation models do not represent distributed energy resources (DERs) in an appropriate manner. In the majority of models, the DERs are assumed to come online and must be accommodated, or they are included as selectable resources but are competing directly with transmission-scale resources with only losses being a benefit.
In the summer of 2020, Vibrant Clean Energy released technical documentation of our WIS:dom®-P v9.0 software. In Section 1.9 is a description of distribution co-optimization. It lays out how to include an interface that accumulates the infrastructure costs of distribution grids across a modeled footprint. In simple terms, it gives the model more data regarding the infrastructure required for distribution without explicitly modeling the entirety of the distribution grids (intractable with today’s computational resources across the entire continental United States). The most important components the distribution interfaces consider are: the peak power draw from the transmission grid, the peak power pushed to the transmission grid, the total electricity purchased from the transmission grid, and the total electricity generated within the distribution grid.
Model Results
Now that we have a model that is capable of performing a co-optimization of distribution- and transmission-scale grid topologies, we decided to ask it to perform two related tasks:
1. Find the lowest-cost electricity system with and without the distribution co-optimization
2. Find the lowest-cost clean electricity system with and without the distribution co-optimization
We found that including the distribution co-optimization reduces the cumulative costs of the electricity system of the continental United States. This result is displayed in Figure 1. When clean electricity is not a target, the savings materialize immediately and reach to over $300 billion cumulatively by 2050. When clean electricity is mandated, the savings are less in the early years (through 2030), but expand rapidly to over $470 billion by 2050. These savings are directly attributed to the co-optimization of the distribution interface and imply that with better coordination between transmission and distribution scales, the value of DERs will exceed their incremental cost compared with transmission-scale alternatives. Moreover, we discovered that clean electricity with the distribution co-optimization activated saves money compared with the business-as-usual simulation without the co-optimization. Put another way, without considering DERs along with the associated distribution infrastructure costs, we could needlessly pay more for electricity and release an additional 10,000 million metric tons of greenhouse gases into the atmosphere.
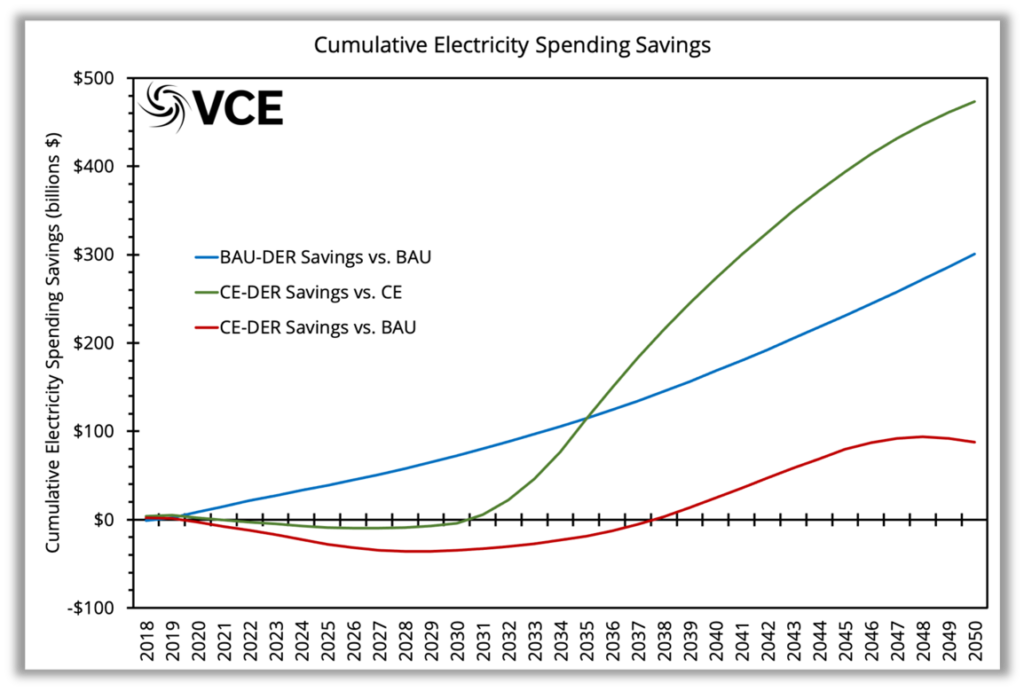
Figure 1: The cumulative electricity system due to the augmentation of the WIS:dom-P software to include distribution planning.
These savings do not come from a zero-sum game of moving generating resources from the transmission grid and placing them into the distribution grid. The result is actually more variable renewable generation on the transmission grid. Figure 2 displays the installed capacities across the continental United States, which shows that the inclusion of the distribution co-optimization does not dramatically alter the macro-level deployments very much. The biggest change is distribution-scale storage being deployed in lieu of some transmission-scale storage.
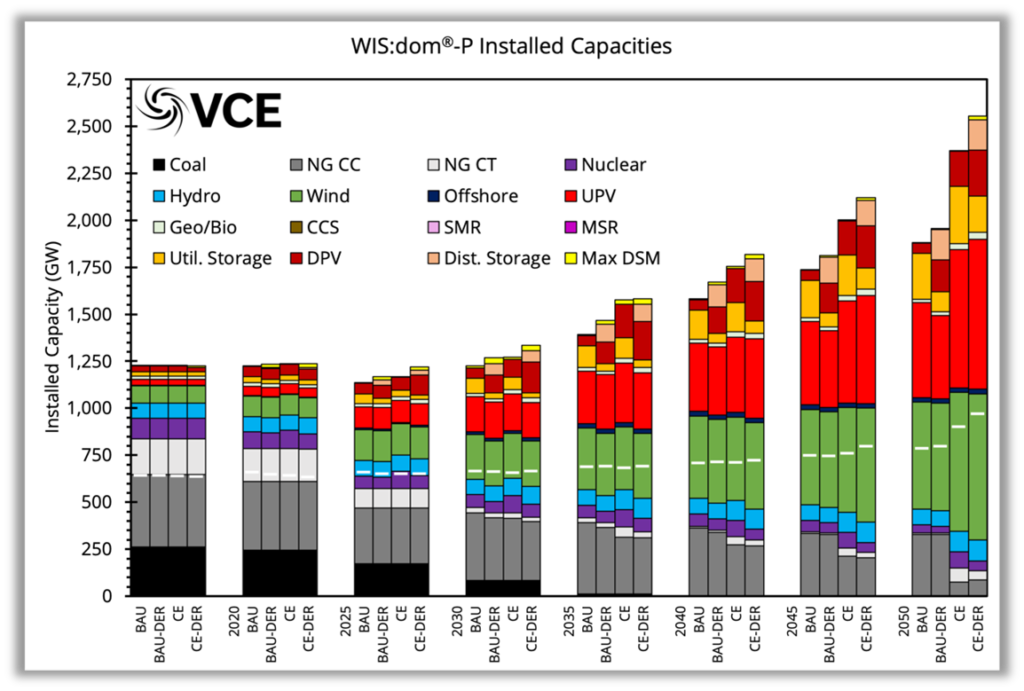
Figure 2: The installed capacities over the continental United States. The white bars indicate the peak coincident demand.
If the installed capacities are not altered dramatically, the savings observed must come from somewhere, but where? We find the savings are embedded in the reshaping of the demand that the transmission grid must serve. Nationally, we see a reduction in coincident peak demand served by the transmission-scale generation of over 15 percent and in some regions in excess of 30 percent. These reductions mean that less capacity is required on the transmission grid. More importantly, because the distribution demand can be shifted, the transmission grid is free to deploy more variable renewables without excessive curtailment. Somewhat counterintuitively, the increase in DER deployment leads to more transmission buildouts to move the excess distribution-scale generation around and handle the variability of those resources more efficiently.
Much Done, More to Come
There is much more detailed analysis contained in our technical report of the study. The deployment map for the clean electricity simulation is displayed in Figure 3. It illustrates the tremendous effort all across the continental United States required at the distribution and transmission scales to reach a clean electricity grid. Deployments need to average 80 GW per annum from 2020 through 2050 to decarbonize the grid (without substantial electrification), while doubling the transmission infrastructure at the same time. The conclusions of the study indicate that we could make the marathon journey on which we must embark for a clean grid easier (and cheaper) if we adopted a coordinated approach between the transmission- and distribution-scale generation. Over the coming months, Vibrant Clean Energy will be releasing more reports detailing our insights into how this distribution interface alters results for an electrified economy, a climate change–altered atmosphere, and an accelerated timeline (2035) for a clean electricity mandate.
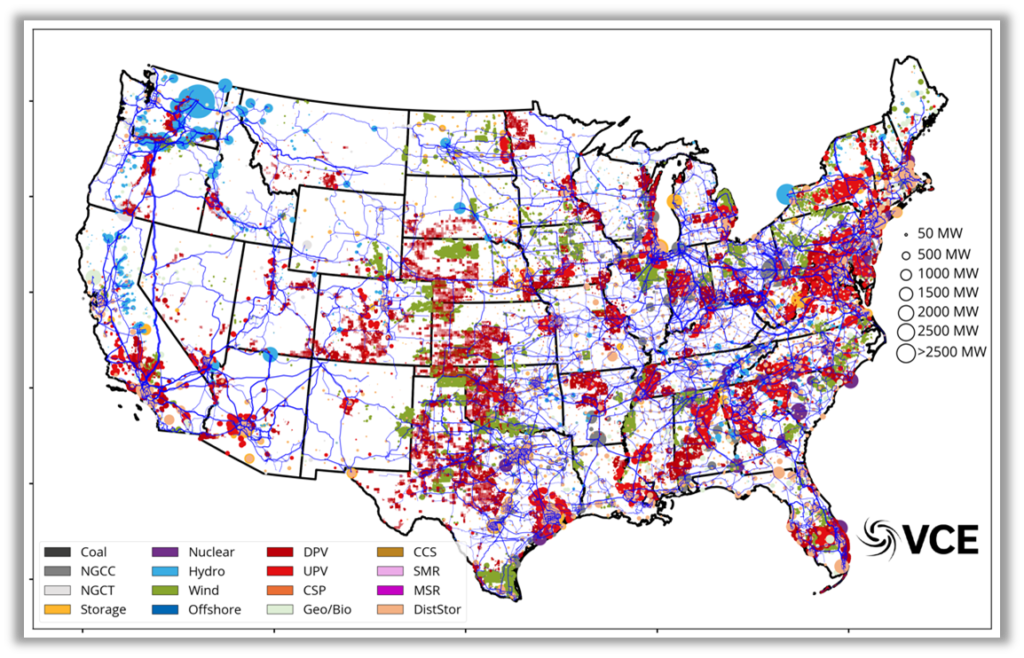
Figure 3: Optimal siting of the generation and transmission for a clean electricity grid.
Christopher Clack
Founder & CEO, Vibrant Clean Energy

Does “distribution co-optimization” imply that the grid operator has some mechanism to control or influence behavior of distribution resources (e.g., curtailment of roof-top PV to avoid surplus generation, timing of EV charging, reliability services, etc)? I agree that distributed resources have values that are often missing from analysis, but the primary challenge has been to understand and implement mechanisms that get distribution resource to respond the power-balance needs of the grid. If we address these challenges, then I agree that there can be significant value.
Hi Russ: Thanks for the comment. The co-optimization assumes that the two grids work to reduce the overall system costs. The model is not assuming that the utility has control of the distribution resources. It assumes that the resources are competing in the market (where deregulated) and reducing their observed costs elsewhere. The impact is that the distribution assets change when and how much power is needed from the utility / transmission grid. This is where the cost savings can really multiply.
This distills to a DSO type entity that orchestrates each distribution grid. These then will have to adjust to the utility supply and demands across the systems. It would be more efficient to have a master controller for everything within the model; however, as we modeled the entire CONUS system, it seemed unreasonable to assume that. So we allowed each region to compete and cooperate as it saw fit.
Much work to be done around how these DSOs and other entities are included in the system paradigm.
Great work, Chris! As we look out over the next 5-10-30 years, the capacity of transmission will no longer be static. It would be interesting to see how increasing deployment of dynamic line ratings impacts the results. The WATT Coalition just released a study conducted by Brattle which shows these technologies can more than double renewable integration.
https://watt-transmission.org/wp-content/uploads/2021/02/Brattle__Unlocking-the-Queue-with-Grid-Enhancing-Technologies__Final-Report_Public-Version.pdf90.pdf
Hi Christopher, thanks for this very clear summary of your research. For many it will be important and perhaps counter-intuitive finding. My underlying assumption is/was that utility scale generation would be most cost efficient than vast numbers of small DER, even taking into account distribution costs. But your results here indicate that the CE-DER scenario, with the highest installed capacity (and so I presume the highest build costs?) is nevertheless the cheapest system overall from 2035 onwards.
I suppose that date does beg one question, with respect to the Biden administration’s focus on a 2035 target for a zero-carbon electricity system. Are you concerned about a path dependency that might lead towards that shorter term outcome which could lock in policy parameters or investment decisions which would preclude the greater savings you see with CE-DER from 2035 onwards?
Thanks for your time!
Hi Christopher,
I was looking at the study and I have a question regarding the savings mentioned:
You compare:
BAU-DER to BAU
CE-DER to CE
and CE-DER to BAU
Doing this in the same graphic can easily be misunderstood and I would like to ask you for helping me get it right.
So the green line CE-DER to CE seems to count with the most savings but actually compares something different. If we look at CE-DER to Bau and BAU-DER to BAU we can understand that actually BAU-DER represents much higher savings.
I am also missing the comparison BAU-DER to CE in order to have a more complete picture.
Best and thanks for sharing the information.
The article highlights the significant transition in the US electricity mix with rapid growth in wind and solar power, alongside increasing distributed solar installations. Vibrant Clean Energy’s study, using advanced modeling techniques, shows that integrating distribution and transmission planning can reduce electricity system costs significantly. By co-optimizing distribution interfaces, savings could exceed $470 billion by 2050 and reduce greenhouse gas emissions. The study challenges the misconception that distributed energy resources (DERs) are inefficient, demonstrating instead that they can enhance grid efficiency and flexibility. The findings advocate for a coordinated approach between transmission and distribution scales, highlighting the potential for more variable renewable generation and efficient handling of distribution-scale resources. This strategy is crucial for achieving clean energy goals and accommodating future electricity demand.